
Figure 2.
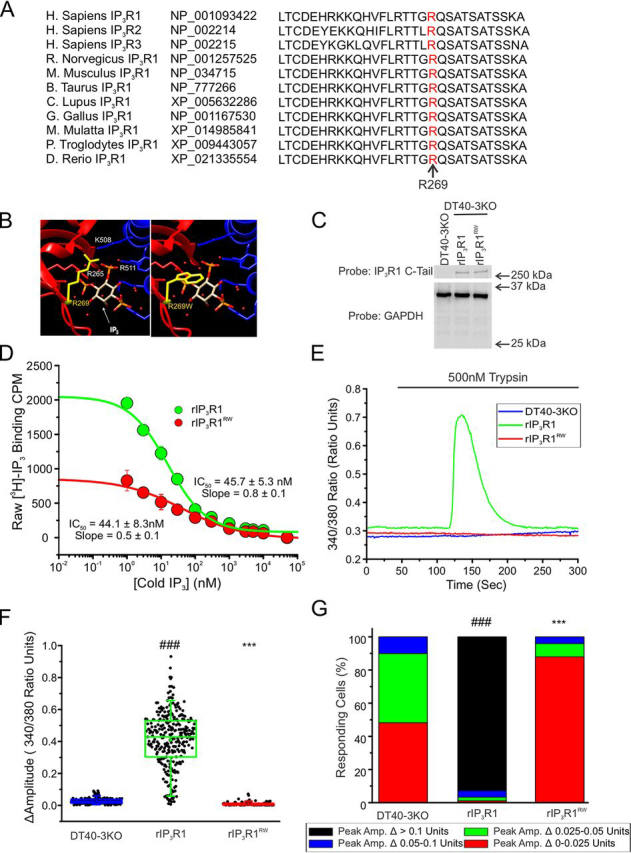
rIP3R1RW is nonfunctional when expressed in DT40-3KO due to decreased IP3 binding.A, Arg-269 (red) is conserved among all three human IP3R isoforms and evolutionarily conserved in the IP3R1 isoform. B, chimera (PDB code 3JAV) was used to visualize WT Arg-269 (yellow, left panel) and R269W mutant Trp-269 (yellow, right panel) interacting with IP3 in the ligand binding cleft. C, WT rIP3R1 and mutant rIP3R1RW cell lines were generated in the IP3R-null DT40-3KO cells and Western blotted. D, binding of 2.5 nm [3H]IP3 to WT rIP3R1 and rIP3R1RW in the presence of increasing concentrations (0 nm, 1 nm, 3 nm, 10 nm, 30 nm, 100 nm, 300 nm, 1 μm, 3 μm, 5 μm, 10 μm, and 50 μm) of cold IP3 in a competitive radioligand-binding assay. Data are mean ± S.E. of three (n = 3) independent experiments. E, representative traces show Ca2+ signals of IP3R-null DT40-3KO cells (blue), WT rIP3R1 (green), and rIP3R1RW (red) in response to trypsin (500 nm) when loaded with Fura-2/AM. F, scatter plots summarizing change in amplitude (peak ratio – basal ratio: average of initial 5 ratio points) for experiments similar to those shown in E. Boxes represent the 25th, 50th, and 75th percentiles, whereas whiskers represent 5th and 95th percentiles and mean is represented by colored circles. G, stacked bar graph summarizing the percentage of amplitudes from F, which fall into pre-determined ranges such that only those cells with an amplitude change greater than 0.1 ratio units (black portion of bars) are considered to be responding to the trypsin stimulus shown in E. Unless otherwise stated, all data above comes from at least n = 3 experiments. ***, p < 0.001 when compared with WT rIP3R1 cell line and ###, p < 0.001 when compared with DT40-3KO cell line; one-way ANOVA with Tukey's test performed in F (F19,4699= 753.0, p < 0.0001) and G (F19,50 = 284.6, p < 0.0001).