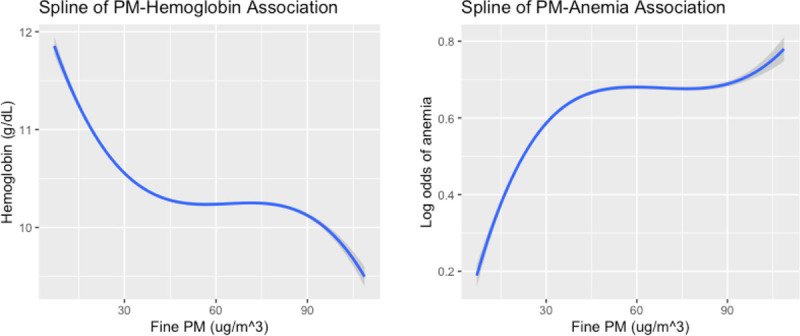
Figure 3.

Penalized splines of the association between ambient PM2.5 exposure and anemia outcomes (L) Spline used to assess potential nonlinearity in association between ambient PM2.5 exposure (μg m–3) and hemoglobin level (g/dL) at the individual level. (R) Spline was used to assess nonlinearity between ambient PM2.5 exposure (μg m–3) and anemia status. Shaded regions denote 95% Confidence bands.
