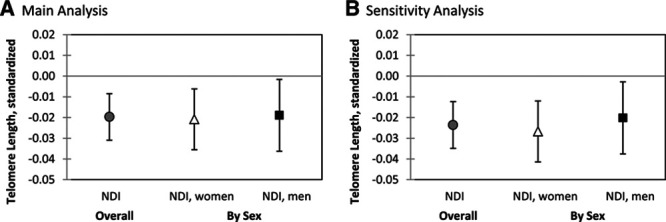
Figure 2.

Association between TL and NDI overall and by sex in the fully adjusted model, showing the estimated effect size and 95% CI associated with an increase of one SD in the NDI. Plot (A) shows the main analysis of NDI and TL and plot (B) shows the sensitivity analysis restricting to subjects who lived at their current address for at least 5 years. Fully adjusted model includes age, sex, smoking, BMI, comorbidities, diet, NDI, and education level. There were no statistically significant differences in the association between NDI and TL by sex (P-value for interaction 0.8973).
