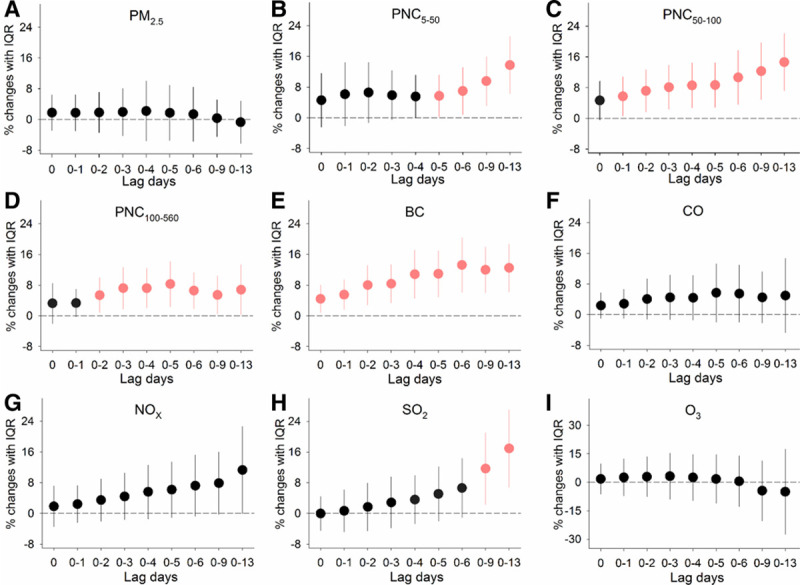
Figure 2.

Percent changes in circulating GDF-15 levels associated with IQR increases in exposure to ambient air pollutants over cumulative lags of 0–13 days. Error bars indicate 95% confidence intervals. Significant associations (P-value < 0.05) are shown in red. The lagged association estimates were derived from linear mixed-effects models coupled with distributed lag non-linear models, with adjustments for body mass index, urinary cotinine, season, ambient temperature, and RH. lag 0, averaged pollutant concentrations over the last 24 hours before each participant’s clinic visit; lag 0–1, 1 to 2 days; lag 0–2, 1 to 3 days and so on up to lag 0–13; PM2.5, fine particulate matter; PNCx, particulate number concentrations in given size ranges (nm).
