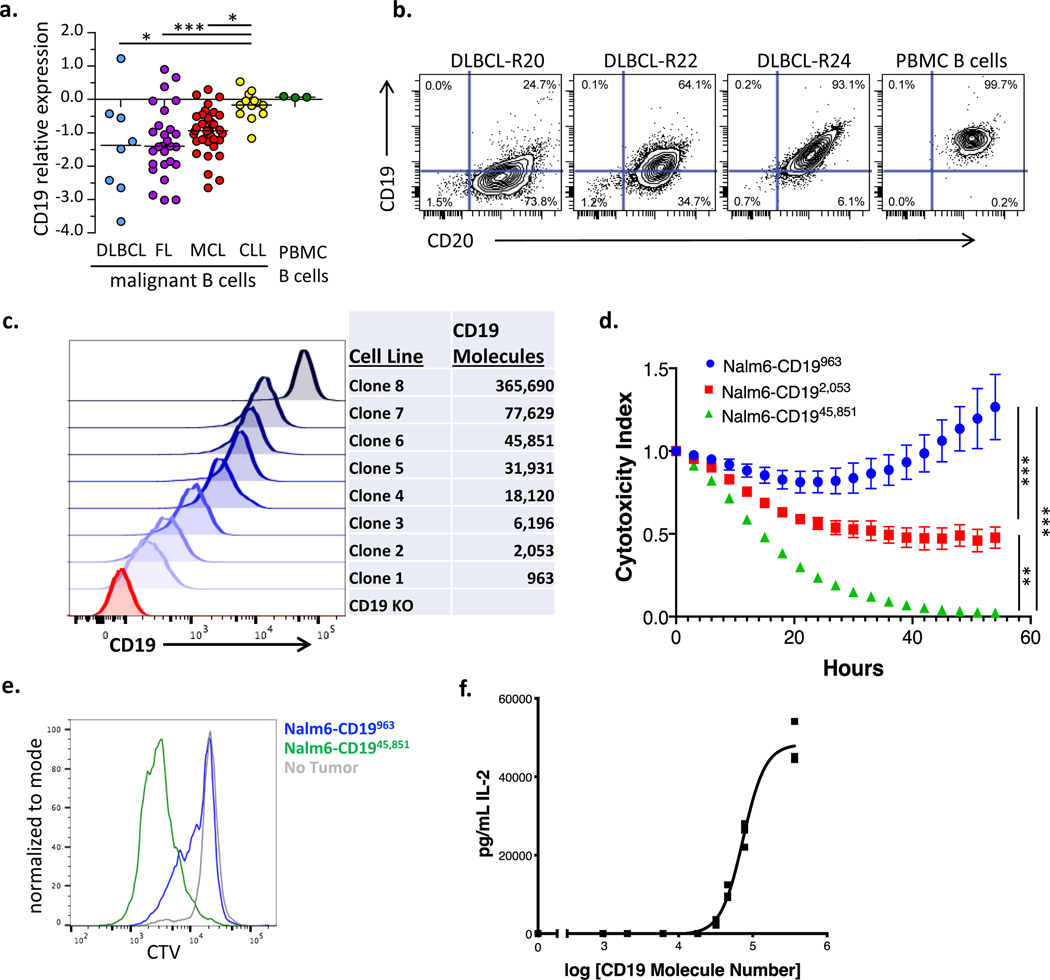
Figure 1: CD19 antigen density influences CD19 CAR activity.
(a) Primary diagnostic samples of diffuse large B cell lymphoma (DLBCL), mantle cell lymphoma (MCL), follicular lymphoma (FL), and chronic lymphocytic leukemia (CLL) were analyzed by flow cytometry for expression of CD19 compared to normal B cells from healthy donors. Shown is CD19 protein expression, relative to healthy donor PBMC B cells on a Log2 scale. DLBCL: n=8, FL: n=27, CLL: n=13, MCL: n=35. Statistical differences between groups were analyzed by one-way ANOVA non-parametric test with Dunns post-test correction. (b) Representative contour plots illustrating expression levels of CD19 and CD20 in three DLBCL cases as compared to PBMC B cells from healthy donors. (c) Flow cytometric analysis of the expression levels of truncated CD19 on the surface of a library of NALM6 clones. Number of molecules of CD19 for each clone were semiquantitatively determined by the BD Quantibrite kit. (d) NALM6 clones expressing indicated densities of surface CD19 molecules were cocultured at a 1:1 ratio with CD19–4-1BBζ CAR T cells and tumor cell killing was measured in an Incucyte assay. Representative of six experiments with different T cell donors. Statistical analysis performed with repeated measures ANOVA. (e) CD19–4-1BBζ CAR T cells were labeled with cell trace violet (CTV) and then cocultured at a 1:2 ratio with NALM6 clones expressing either 963 or 45,851 molecules of surface CD19. T cell proliferation was measured by flow cytometry four days later. Representative of three experiments with different T cell donors. (f) CD19–4-1BBζ CAR T cells were cocultured with NALM6 clones expressing various amounts of CD19 for 24 hours and secreted IL-2 was measured by ELISA. Shown is the concentration of cytokine measured as compared to log of the CD19 molecule number for that specific clone and curve fitting was done using a four-parameter variable slope dose-response curve. Representative of six experiments with different T cell donors. For all experiments, error bars represent SD. p < 0.05 was considered statistically significant, and p values are denoted with asterisks as follows: p > 0.05, not significant, NS; * p < 0.05, ** p < 0.01, *** p < 0.001, and **** p < 0.0001.

