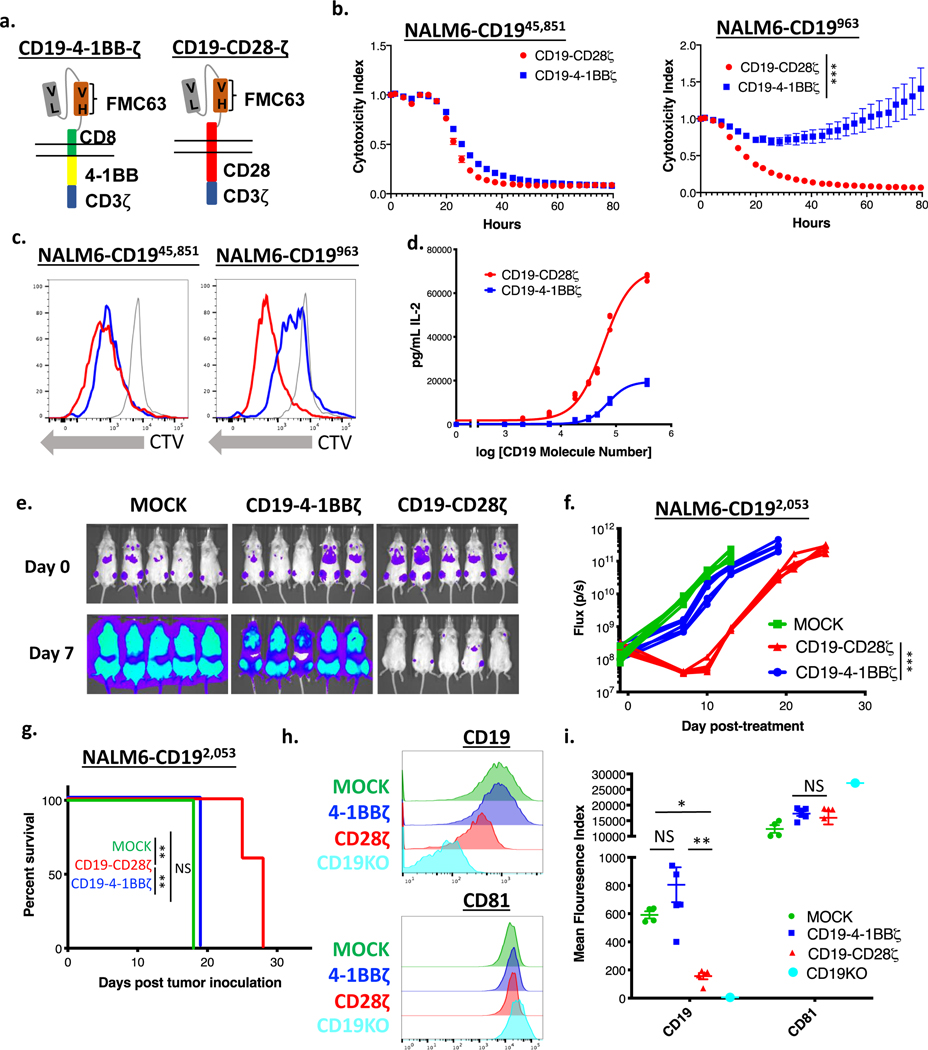
Figure 2: CD19-CD28ζ CAR T cells display superior activity compared to CD19–4-1BBζ CAR T cells against low antigen density target cells.
(a) Schema of CARs employed in these experiments. The CD19–4-1BBζ CAR molecule is identical to the CAR construct contained in tisagenlecleucel while the CD19-CD28ζ CAR molecule is identical to the CAR construct contained in axicabtagene ciloleucel. (b) NALM6 clones expressing either 963 or 45,851 molecules of surface CD19 were cocultured at a 1:1 ratio with either CD19-CD28ζ or CD19–4-1BBζ CAR T cells and tumor cell killing was measured in an Incucyte assay. Representative of six experiments with different T cell donors. Statistical analysis performed with repeated measures ANOVA. (c) CD19-CD28ζ and CD19–4-1BBζ CAR T cells were labeled with cell trace violet (CTV) and then cocultured with NALM6 clones expressing either 963 or 45,851 molecules of surface CD19. T cell proliferation was measured by flow cytometry four days later. Representative of three experiments with different T cell donors. (d) CD19-CD28ζ and CD19–4-1BBζ CAR T cells were cocultured with NALM6 clones expressing various amounts of CD19 for 24 hours and secreted IL-2 was measured in the supernatant by ELISA. Shown is the concentration of cytokine measured as compared to log of the CD19 molecule number for that specific clone and curve fitting was done using a four-parameter variable slope dose-response curve. Representative of six experiments with different T cell donors. (e) One million NALM6-CD192,053 cells were engrafted into NSG mice by tail vein injection. Four days later, mice were injected with 3 million CD19-CD28ζ CAR T cells, CD19–4-1BBζ CAR T cells, or untransduced control T cells (MOCK). Tumor progression was measured by bioluminescence photometry and flux values (photons per second) were calculated using Living Image software. Representative images are shown. (f) Quantified tumor flux values for individual mice treated as in (e). The MOCK group on day +15 were either found dead prior to imaging or sick with limited perfusion such that imaging results were unreliable and were thus excluded. Statistical analysis performed with repeated measures ANOVA. (g) Survival curves shown for mice treated as in (e). Statistical analysis performed with the log-rank test. (e-g) are representative of six experiments with different T cell donors (n=5 mice per group). (h, i) Leukemia cells from the bone marrow of treated mice (n=5) were phenotyped by flow cytometry for expression of CD19 and CD81. The CD19 knockout cell line from cell culture was used as reference control. Shown are representative flow plots (h) and quantified mean flouresence intensity (MFI) data (i). Representative of three different experiments with different T cell donors. Statistical comparisons performed by Mann Whitney between the indicated groups. For in vitro experiments, error bars represent SD and for in vivo experiments, error bars represent SEM. p < 0.05 was considered statistically significant, and p values are denoted with asterisks as follows: p > 0.05, not significant, NS; * p < 0.05, ** p < 0.01, *** p < 0.001, and **** p < 0.0001.

