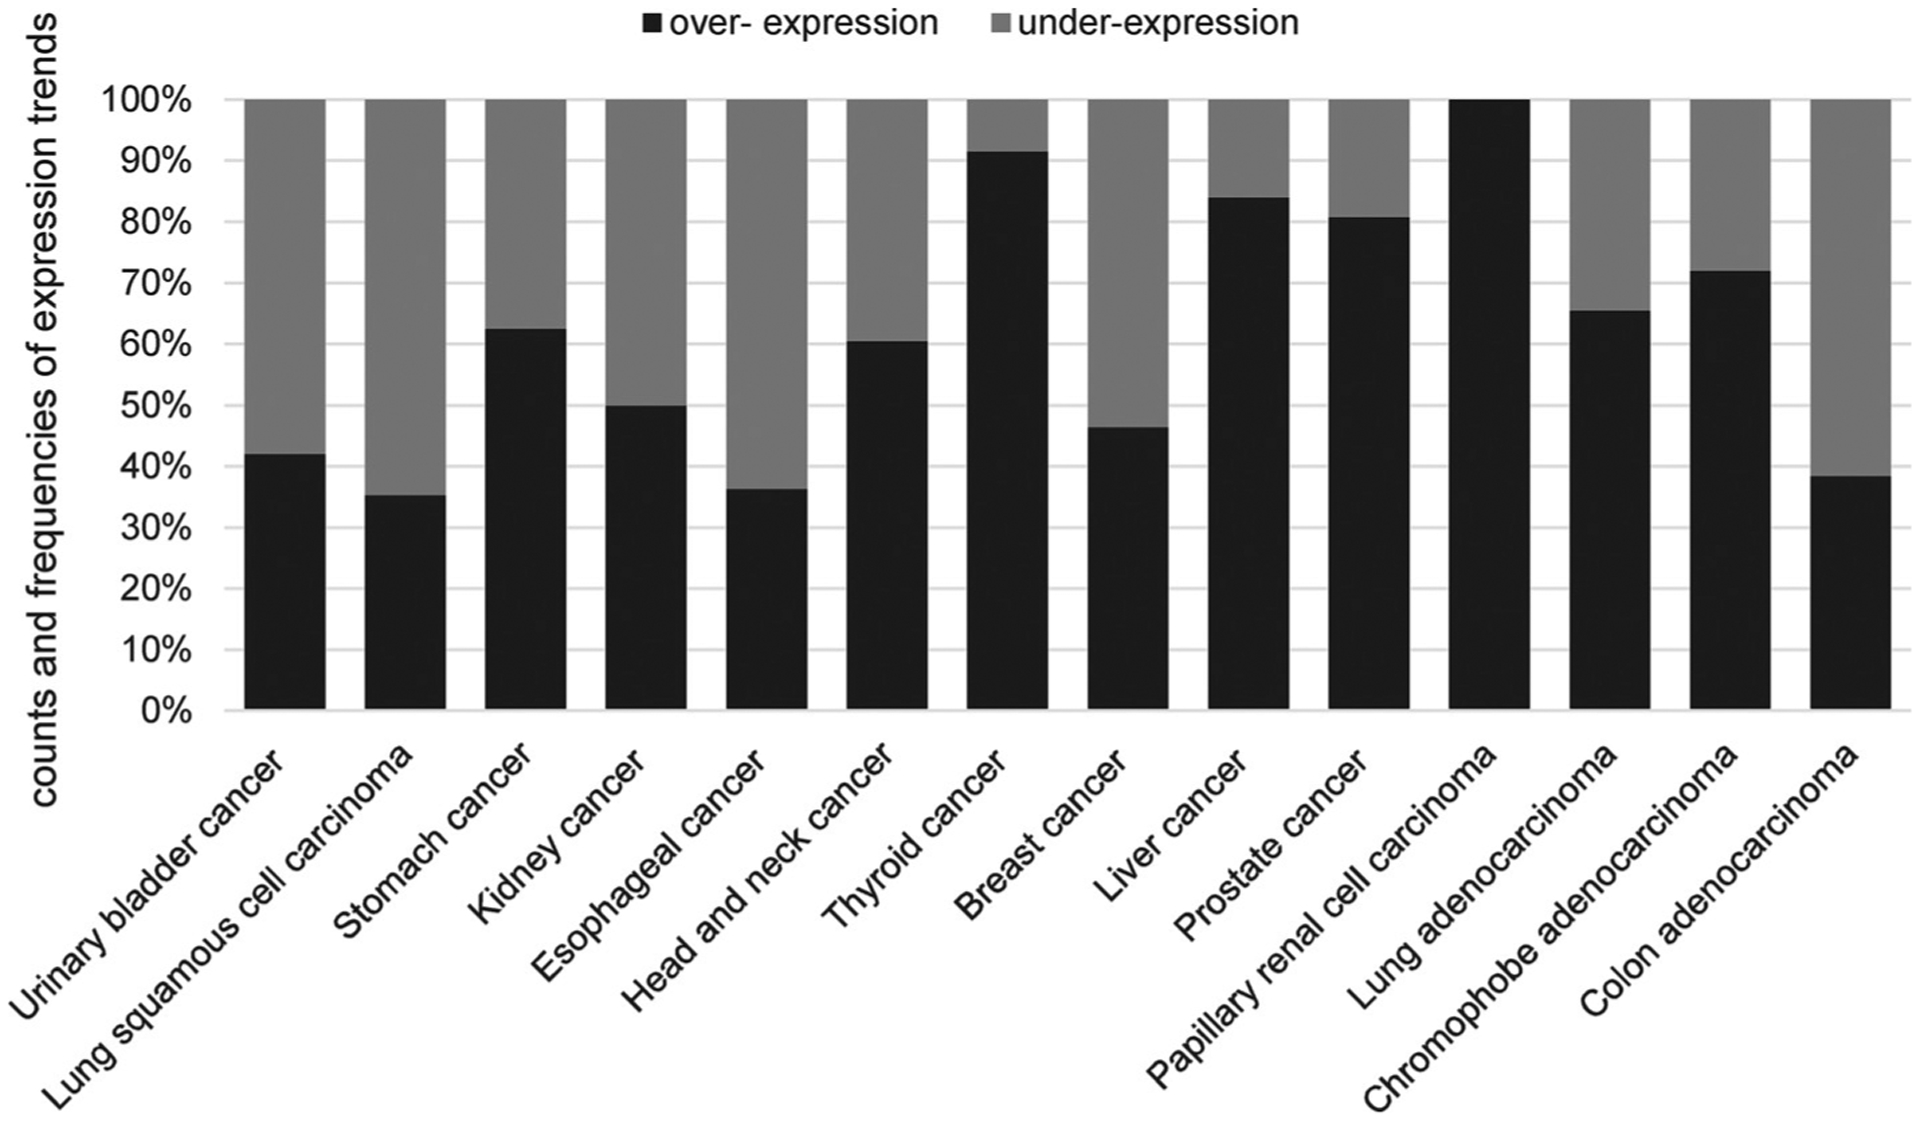
Fig. 8.

Expression trend frequency of different cancer types. Frequencies of patients following each expression trend for CK1δ are presented for all relevant cancer types. For each patient, log2 fold-change (log2FC) values greater than zero were considered to follow an over-expression trend, less than zero to follow an under-expression trend. Patients with log2FC = 0 were excluded from the dataset. Note that all patients are included in this graphic, irrespective of statistical significance of the trend. Data is based on the BioXpress online tool (Wan et al., 2015; Dingerdissen et al., 2018).
