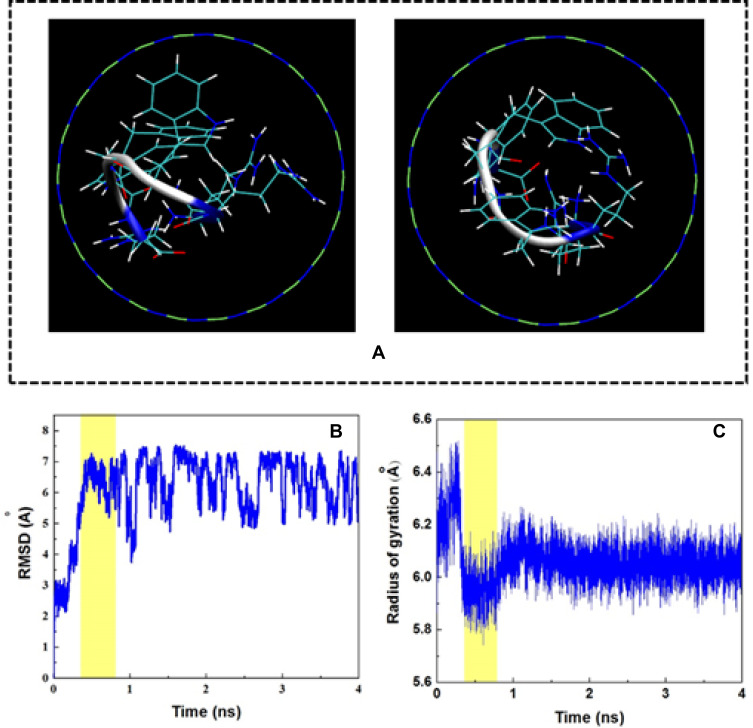
Figure 5.
(A) Axial views of the cationic antimicrobial peptide cRW3 at 0 ns and 4 ns in the MD simulation. For clarity, water molecules were not shown. (B) Root mean square deviation (RMSD) of cRW3 as a function of simulation time. (C) Gyration radius of cRW3 as a function of simulation time. The yellow regions illustrate the encapsulation period.

