
Fig. 2. CMA suppresses the pluripotency of ES Cells.
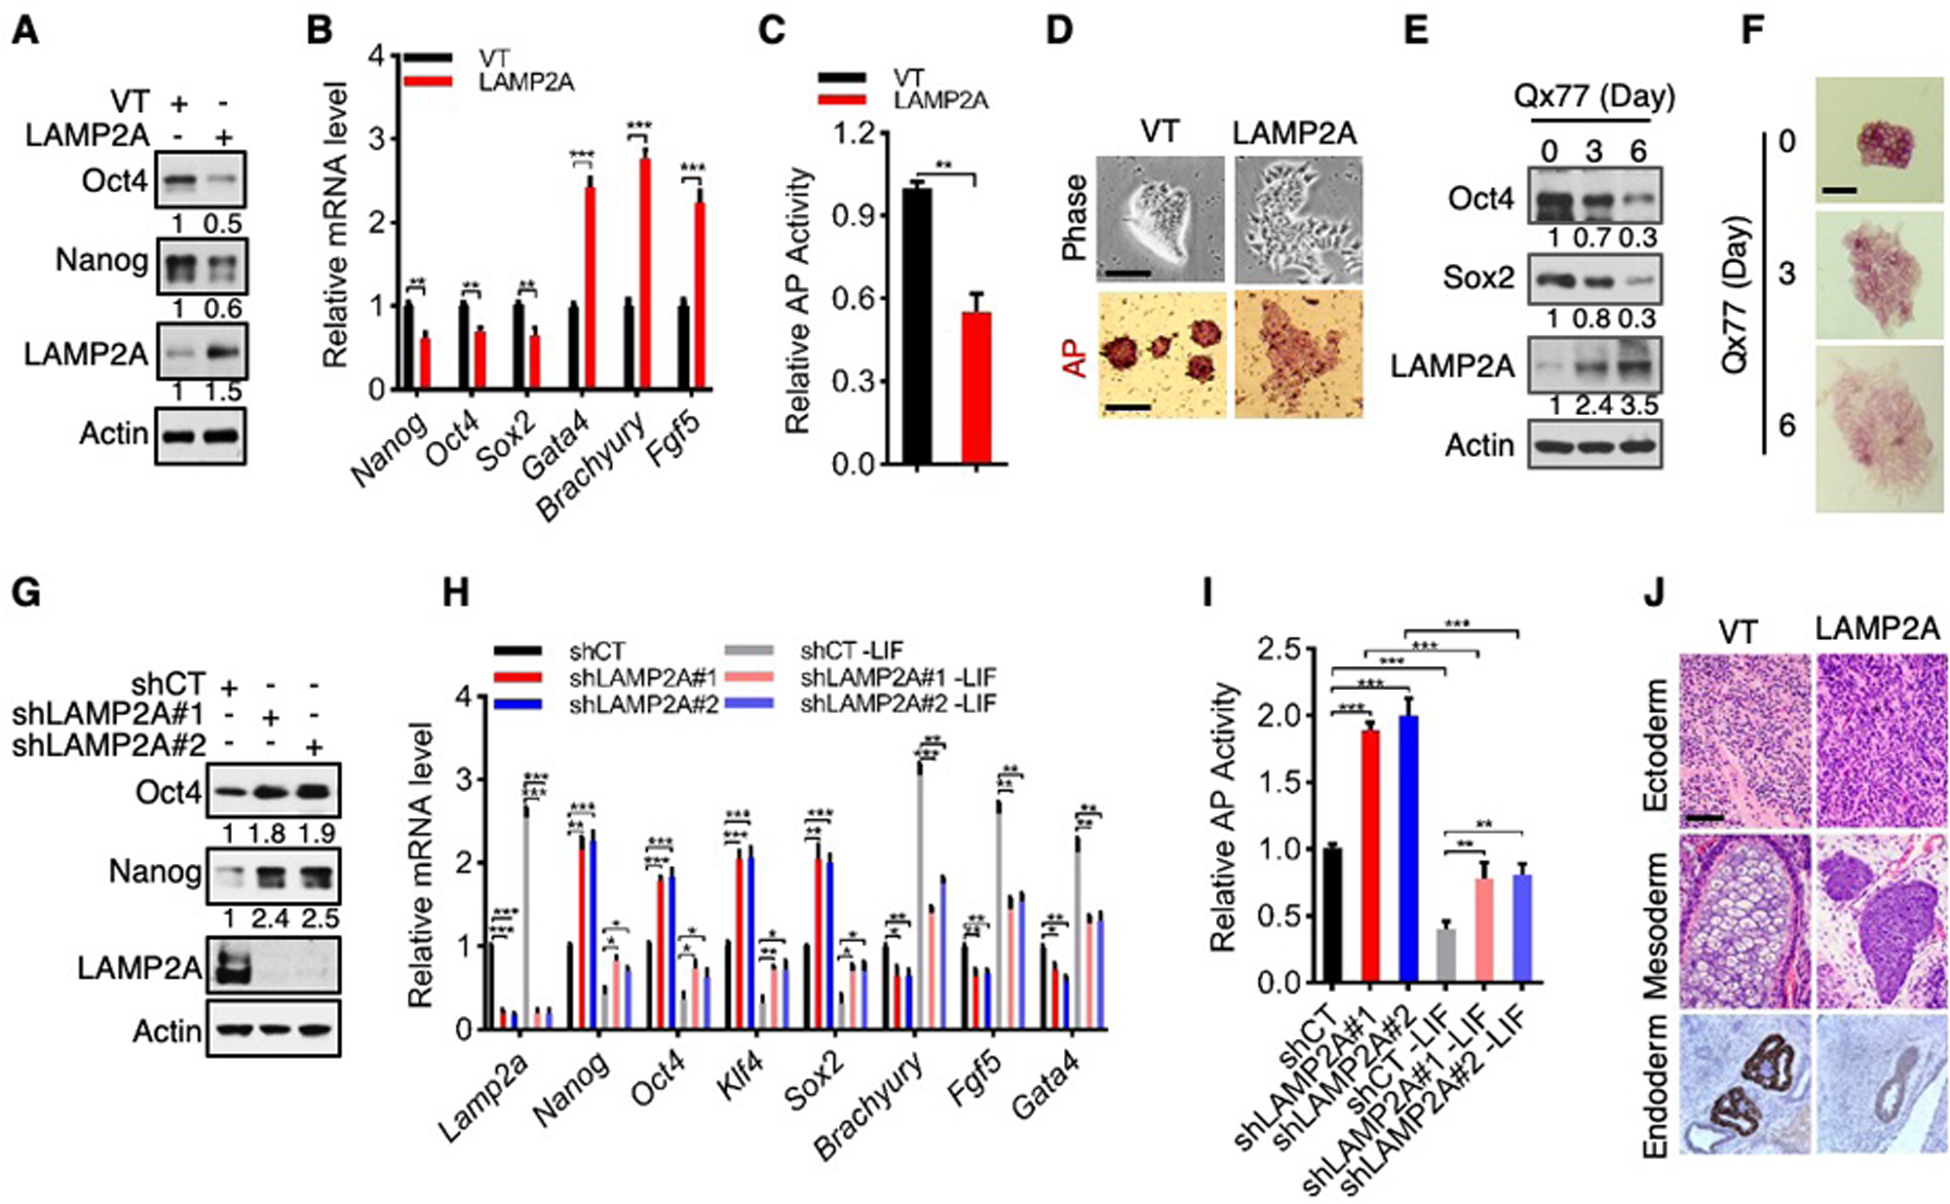
(A to D) Protein (A) and mRNA (B) levels, AP activity (C), and representative phase-contrast (D, top) and AP staining (D, bottom) images of D3 cells stably expressing vector control (VT) or LAMP2A. Scale bars: 100 μm.
(E and F) Protein levels (E) and representative images of AP staining (F) of D3 cells treated with 10 μM Qx77. Scale bars: 100 μm.
(G to I) Protein (G) and mRNA (H) expression, and AP activity (I), in control and LAMP2A-knockown D3 cells cultured in normal (G to I) or LIF-deprived medium.
(J) H&E (top and middle) and Gata4 IHC (bottom) staining of teratomas formed by control and LAMP2A-overexpressing D3 cells. Scale bar: 200 μm.
Data are mean ± SD (n = 3 biological replicates). *P < 0.05, **P < 0.01, ***P < 0.001, unpaired Student’s t-test.