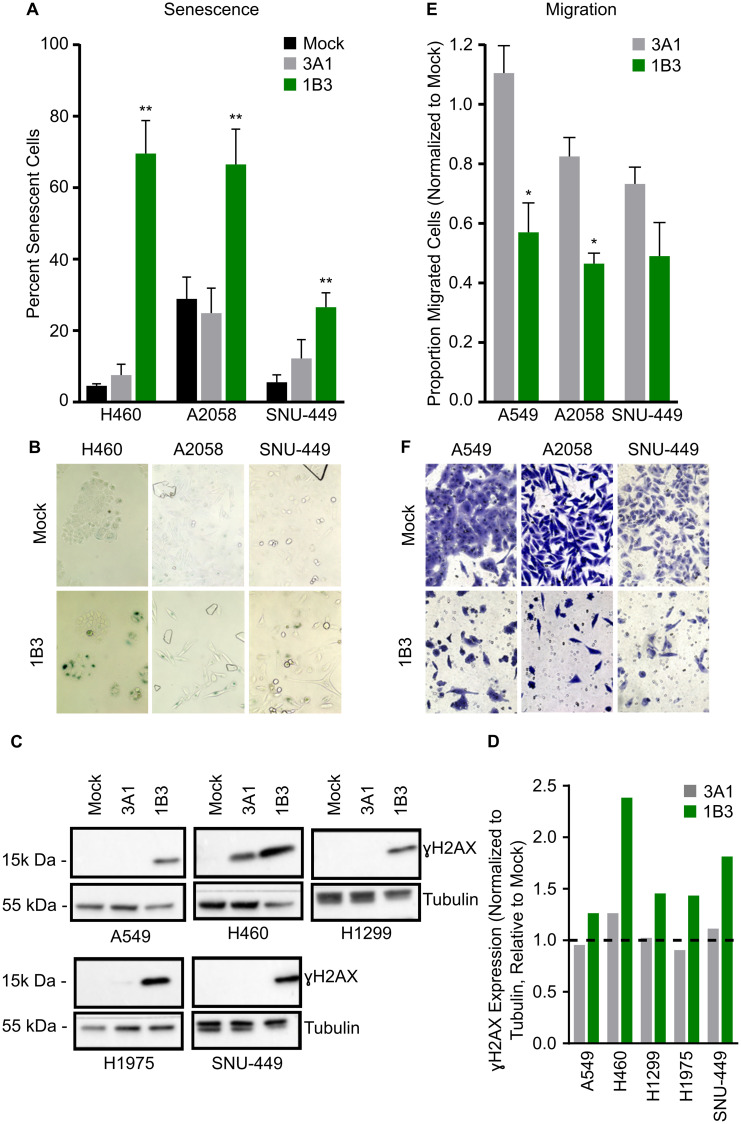
Figure 2. Effect of 1B3 on tumor cell senescence, migration, and DNA damage.
Cells were transfected with either 1B3 or ‘negative’ miRNA control (3A1) in the presence of RNAiMAX transfection reagent. Non-transfected cells (mock) were included to define baseline readout. (A) Senescence was assayed using the SA-β galactosidase assay (Cell Signaling) four days after transfection with 10-nM of either 1B3 or 3A1, and 500 cells in total counted for each condition. The proportion of senescent cells relative to non-senescent cells was calculated. Error bars show the standard deviation of three biological replicates. ** indicates p < 0.01 calculated by Dunnett’s multiple comparison test. Representative images of senescence after transfection with 1-nM 1B3 (B) were captured at 10x magnification. (C) Cell lysates for Western blotting for ɣ-H2AX were harvested 72 h after transfection with 10-nM of either 1B3 or 3A1. Ten to 20 μg protein was separated by SDS-PAGE, transferred to PVDF membranes, and hybridized with ɣ-H2AX and tubulin antibodies. Tubulin was used as protein loading control. Band intensities were quantified by densitometry using ImageJ software (D) and values normalized to the tubulin loading control and are shown relative to mock transfected cells. The dashed line represents the mock value of 1. (E) Transwell cell migration was assayed 48 h after transfection with 10-nM or either 1B3 or 3A1. Ten images per condition at 20x magnification were counted. Values were corrected for the effect of 1B3 on viability using counts from a concurrent 24-well cell culture plate. Values were normalized to mock (mock = 1). Error bars show the standard deviation of two independent replicates. * indicates p < 0.05 calculated by two-tailed t-test. Representative images of migration after transfection with 10-nM 1B3 (F) were captured at 20x magnification.

