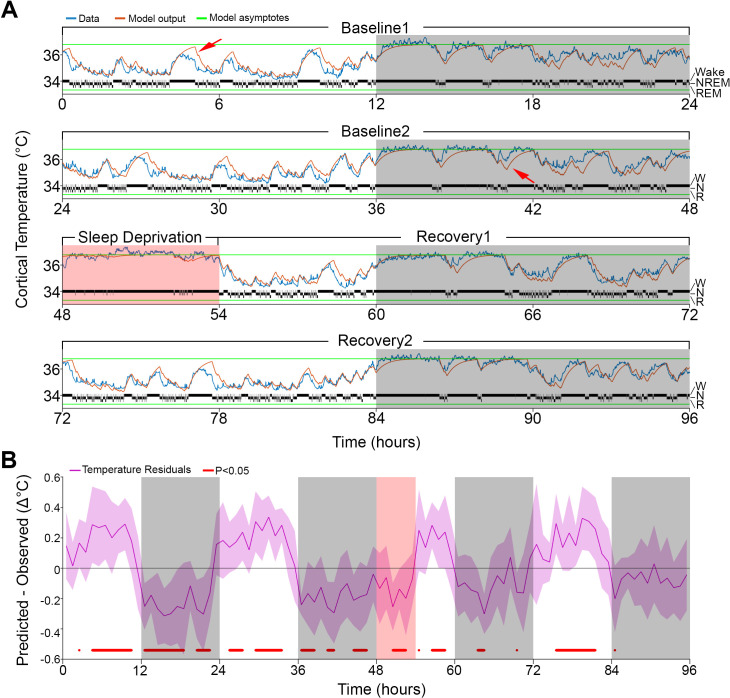
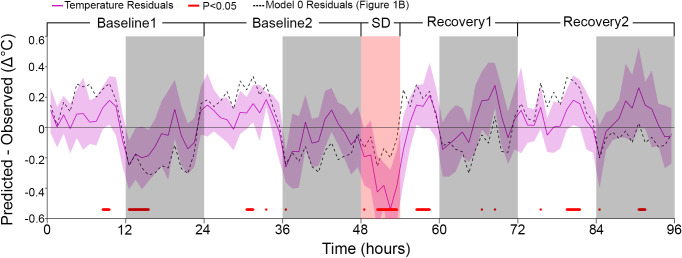
Figure 1. Results of Model 0 with constant asymptotes.
(A) A representative example of a 96-hr recording in one mouse of brain temperature (blue) and simulated data (orange). Green lines represent the model's lower and upper asymptotes. The 4-s hypnogram of wake (W), non–rapid-eye-movement sleep (N), and rapid-eye-movement sleep (R) appears above the lower asymptote. White/gray backgrounds represent 12 hr light–dark periods, respectively, and the salmon background starting at 48 hr indicates the 6 hr of sleep deprivation. Red arrows point to examples of over/under estimation of the model in the light–dark periods, respectively. (B) Hourly differences (mean ± STD) between simulation output and data. Red marks below the graph represent significant differences, tested by paired t-tests and false discovery rates corrected at p<0.05. Hourly values are plotted at the interval midpoint. White/gray/salmon backgrounds as in (A).


