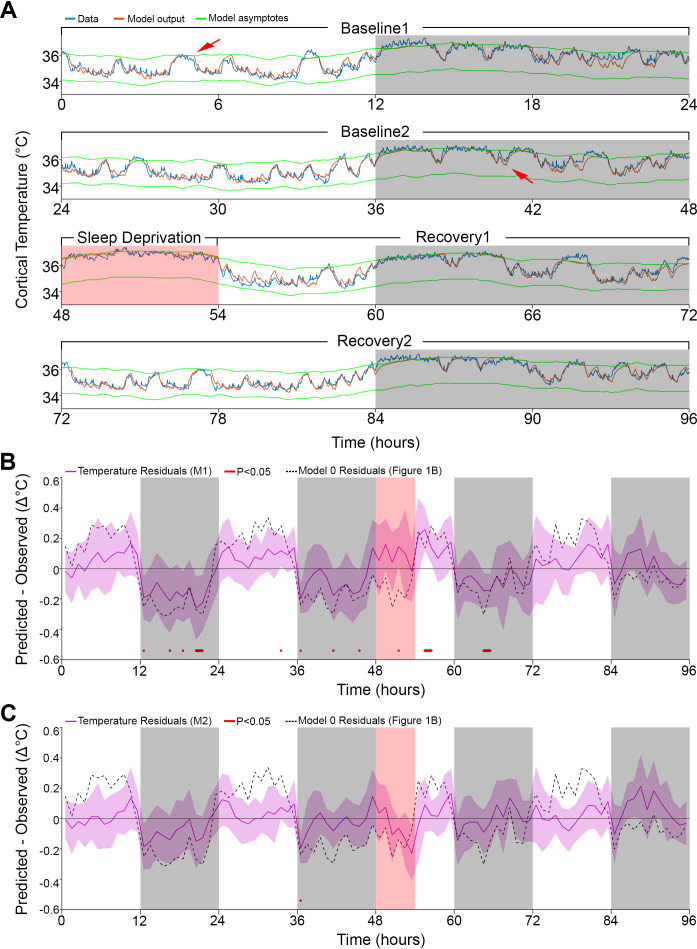
Figure 2. Results of models 1 and 2 with modulation of asymptotes.
(A). Simulation fit (orange) after incorporating prior wake prevalence (Model 1). Note that both asymptotes (green) are modulated in parallel, recorded data (blue line) are of the same animal as in Figure 1, and previous over- and under-estimations marked by red arrows are diminished. White/gray/salmon backgrounds indicate light/dark/SD periods, respectively. (B,C). Residuals of models 1 and 2, as in Figure 1B, after the addition of prior wake prevalence (B, Model 1, M1) and with an additional circadian rhythm modulation of both asymptotes (C, Model 2, M2). Dashed lines mark the mean temperature residuals of Model 0, from Figure 1B. Red marks indicate significant deviations from zero. Note the reduction in the number of red marks from Figure 1B, to Figure 2B to Figure 2C.

