. 2021 Mar 8;10:e62073. doi: 10.7554/eLife.62073

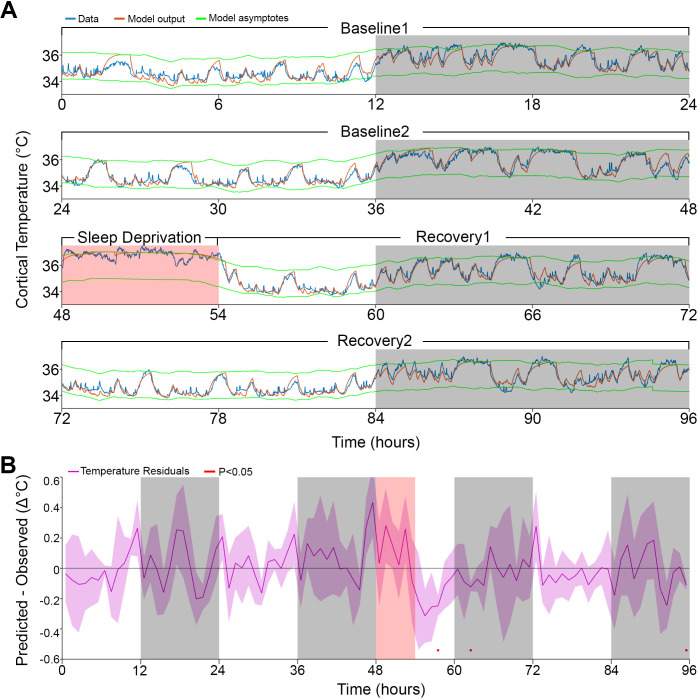
Figure 4. Model fit to a novel dataset.

(A) Representative example of the Model 2 fit (orange) to novel raw data (blue) not used for optimization, using the median of the optimized parameters from the original dataset (Table 1). (B) Temperature residuals of Model 2 (mean ± STD) across all animals in the novel dataset. Notice the small number of red markers, indicating significant deviations from zero. White/gray/salmon backgrounds in both panels indicate light/dark/sleep deprivation periods, respectively.

Figure 4.

Figure 4—figure supplement 1. Correlation between initial temperature to wake and rapid-eye-movement (REM) sleep prevalence.
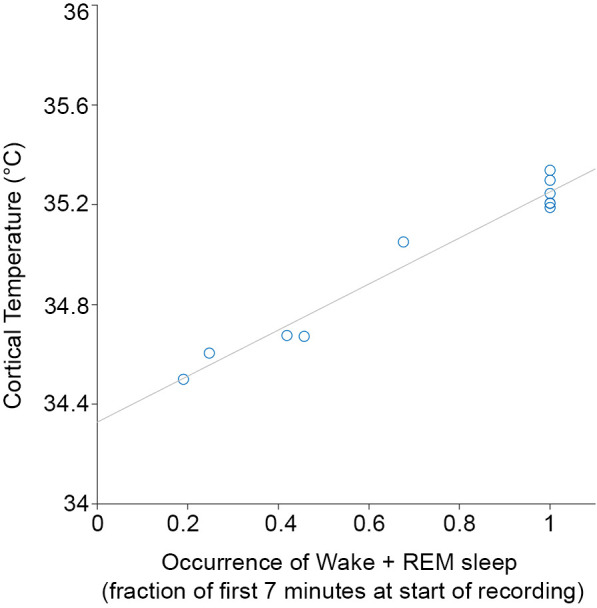
Figure 4—figure supplement 1.

The average of the normalized temperatures (see 'Materials and methods') in the first 7 min of the recording (i.e., light onset of baseline 1) is plotted against the fraction of occurrence of wake and REM sleep in the same time window for the 11 individual recordings from the main experiment. The high correlation justifies predicting the temperature values of further sessions from sleep–wake state sequences alone.

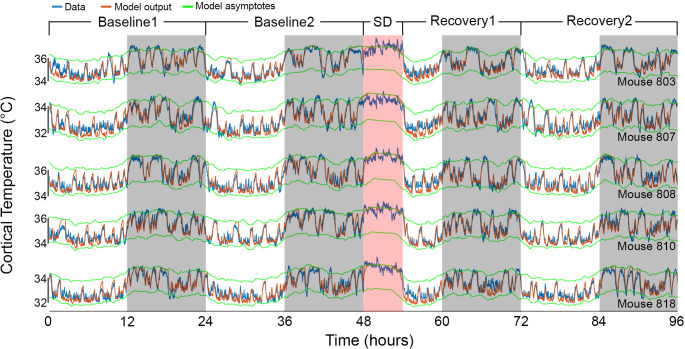
Figure 4—figure supplement 2. Results of Model 2 for each mouse of the independent cohort.

Figure 4—figure supplement 2.

The graphs show the fit (orange) according to Model 2, for an additional set of five animals (data in blue), based on the median parameters of our main group of mice (Table 1). Mouse number 810 in the fourth row appears also in Figure 4A. White/gray/salmon backgrounds in both panels indicate light/dark/sleep deprivation (SD) periods, respectively.