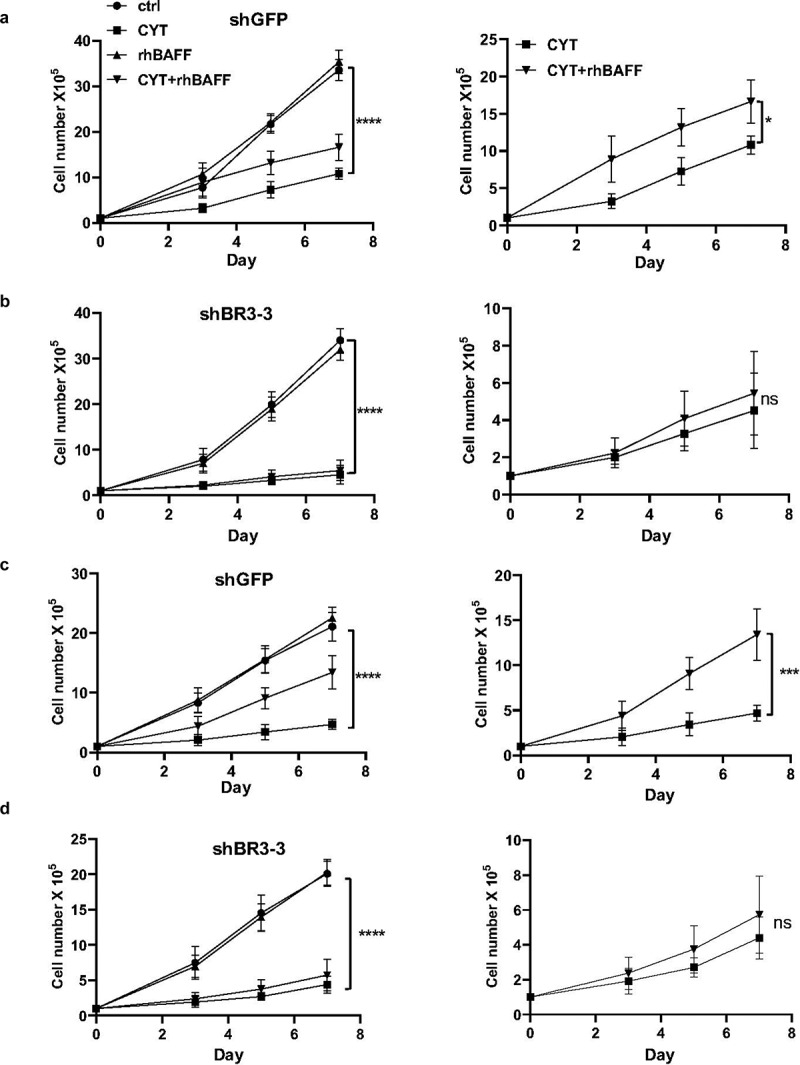
Figure 3.

BAFF stimulation failed to antagonize cytarabine-induced BAFF-R knockdown MCL cell death. (a) 1 × 10⁵ Jeko-1 cells expressing shGFP were seeded in 24-well plate in triplicates for a week. The cells were treated with different combination of components such as untreated (ctrl), CYT, rhBAFF, and CYT+rhBAFF. The cell number was plotted. ****p < .0001 represents untreated shGFP cells as compared to cytarabine-treated cells. *p < .05 represents cytarabine-treated shGFP cells in comparison to combined treatment of cytarabine and recombinant BAFF. Experiments shown are representative of three replicates from one experiment. (b) 1 × 10⁵ Jeko-1 cells expressing shBR3-3 were seeded in 24-well plate in triplicates for a week. The cells were treated with different combination of components such as ctrl, CYT, rhBAFF and CYT+rhBAFF. The cell number was plotted. ****p < .0001 represents untreated shBR3-3 cells as compared to cytarabine-treated cells. Experiments shown are one representative experiment of three experiments done with replicates; Not significant (ns) for the comparison of cytarabine-treated shBR3-3 cells in comparison to combined treatment of cytarabine and recombinant BAFF. (c) 1 × 10⁵ Mino cells expressing shGFP were seeded in 24-well plate in triplicates for a week. The cells were treated with different combination of components such as ctrl, CYT, rhBAFF, and CYT+rhBAFF. The cell number was plotted. ****p < .0001 represents untreated shGFP cells as compared to cytarabine-treated cells. ***p < .001 represents cytarabine-treated shGFP cells in comparison to combined treatment of cytarabine and recombinant BAFF. Experiments shown are representative of three replicates from one experiment. (d) 1 × 10⁵ Mino cells expressing shBR3-3 were seeded in 24-well plate in triplicates for a week. The cells were treated with different combination of components such as ctrl, CYT, rhBAFF, and anti-BAFFR. The cell number was plotted. ****p < .0001 represents untreated shBR3-3 cells as compared to cytarabine-treated cells; ns shows the comparison of cytarabine-treated shBR3-3 cells in comparison to combined treatment of cytarabine and recombinant BAFF. Error bars are from single experiment done with triplicate samples representative of three such experiments done with triplicates
