Figure 3.

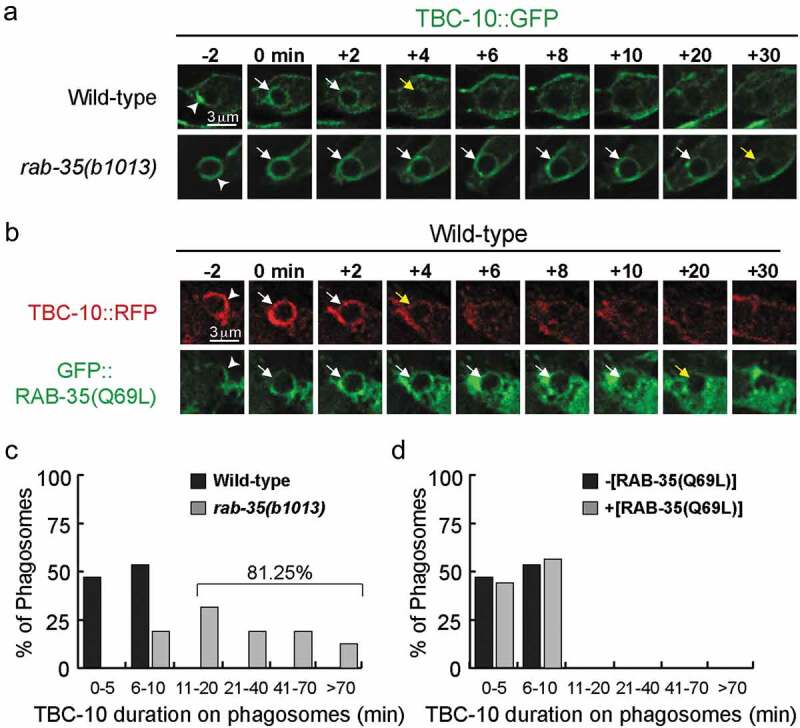
In rab-35 mutants, the disappearance of TBC-10 from phagosomal surfaces is significantly delayed
(a) Time-lapse images during and after the formation of the C3 phagosome in wild-type and rab-35(b1013) embryos expressing Pced-1 tbc-10::gfp. ‘0 min’ is the moment when a phagosome is just formed. Arrowheads mark extending pseudopods, white arrows mark phagosomes where TBC-10::GFP is visible, and yellow arrows indicate the first time point when TBC-10::GFP is no longer visible on phagosomes.(B) Time-lapse images during and after the formation of the C3 phagosome in wild-type embryos that coexpressed Pced-1 tbc-10::mrfp and Pced-1 gfp::rab-35(Q69L). ‘0 min’ is the moment when a phagosome is just formed. Arrowheads mark extending pseudopods, white arrows mark phagosomes where either TBC-10::RFP or GFP::RAB-35(Q69L) is visible, and yellow arrows indicate the first time point when either TBC-10::RFP or GFP::RAB-35(Q69L) are no longer visible on phagosomes.(c-d) Histogram displaying the range of time that TBC-10::GFP is observed on the surface of phagosomes bearing C1, C2, and C3 in wild-type and rab-35(b1013) mutant embryos (c), and in wild-type mutant embryos that either express no transgene or express Pced-1gfp::rab-35(Q69L) (d). The time interval is defined as that between when TBC-10::GFP is first observed on the phagosome (‘0 min’) and the first time point when this GFP::TBC-10 signal can no longer be observed. For each genotype, at least 15 phagosomes were scored.
