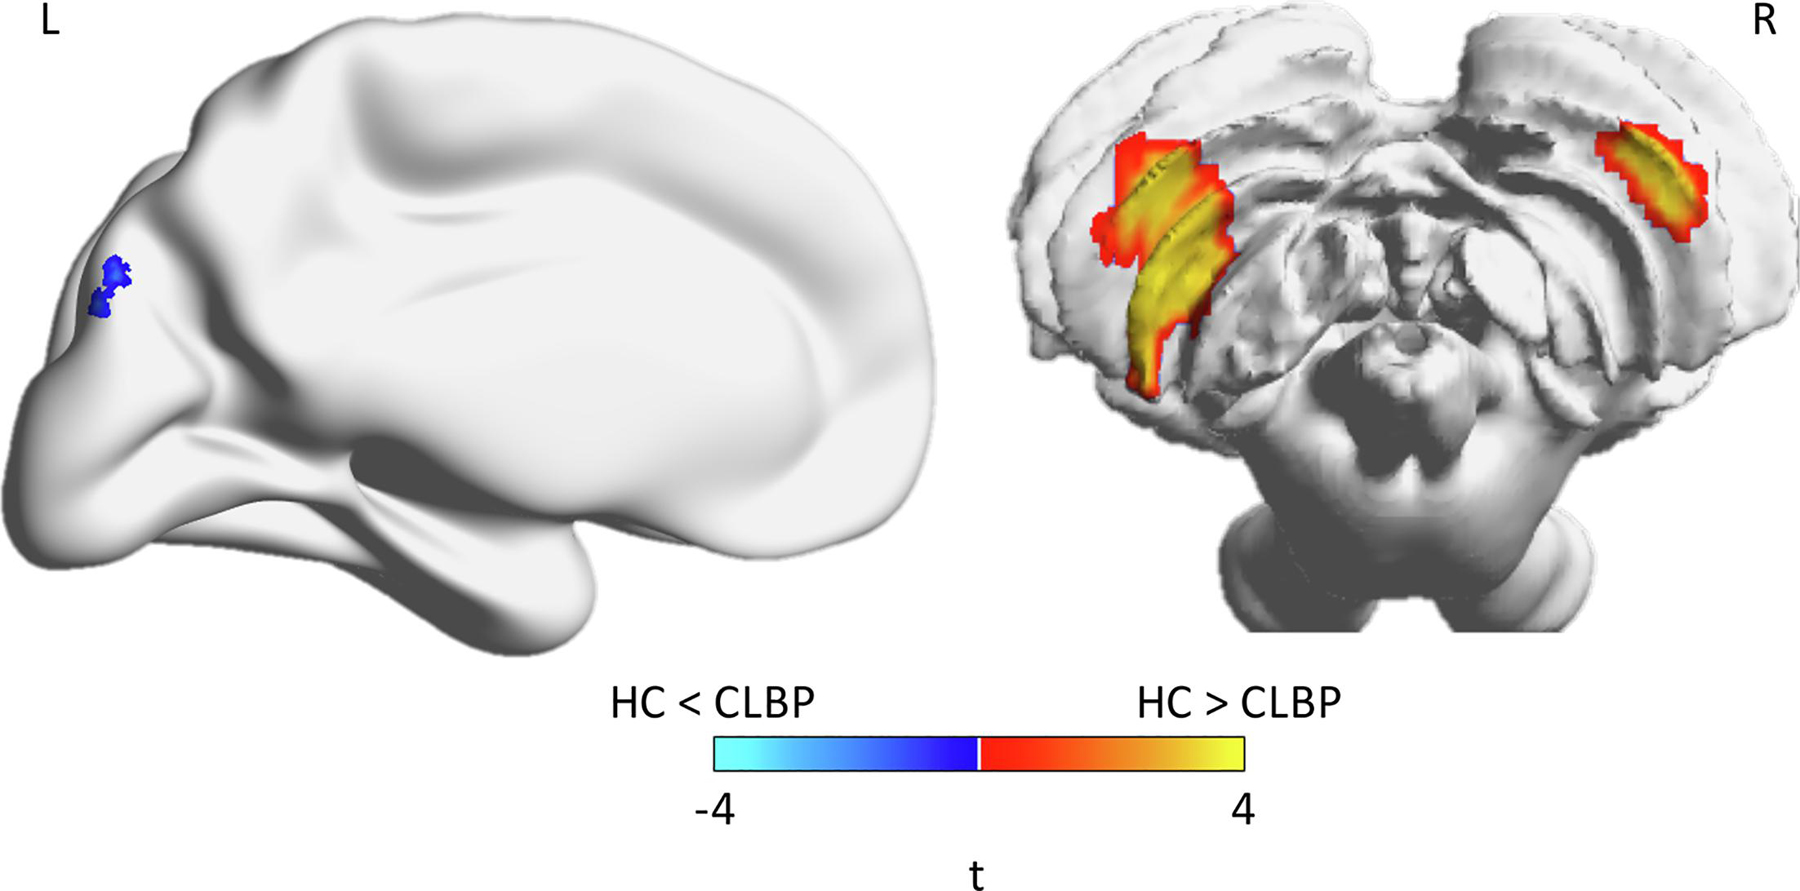
Figure 2:

Individuals with CLBP have lower gray matter density - Regions showing significant differences in gray matter density between HC and CLBP (corrected for multiple comparisons). Independent t-test values are plotted on the brain, where cooler colors indicate HC < CLBP while warmer colors indicate HC > CLBP. Brains are plotted using BrainNet Viewer. Note that the cerebellum is shown in radiological view (left-right flipped).
