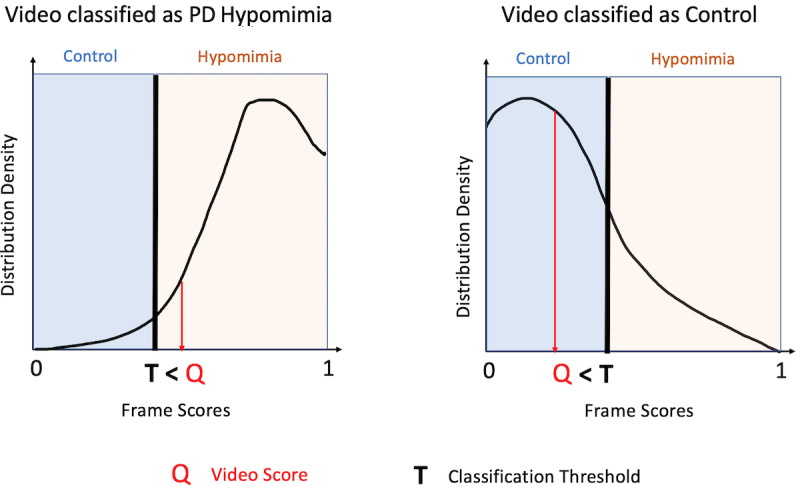
Figure 2.

Video scoring. To classify a video, a probability distribution is created for all of a video’s frames, and the fifth percentile of the distribution is defined as Q. A video that has a Q value above T (ie, closer to 1 or more evidence of hypomimia) is categorized as PD hypomimia; a video with a Q value below T (ie, closer to 0 or less evidence of hypomimia) is categorized as Control. PD: Parkinson disease.
