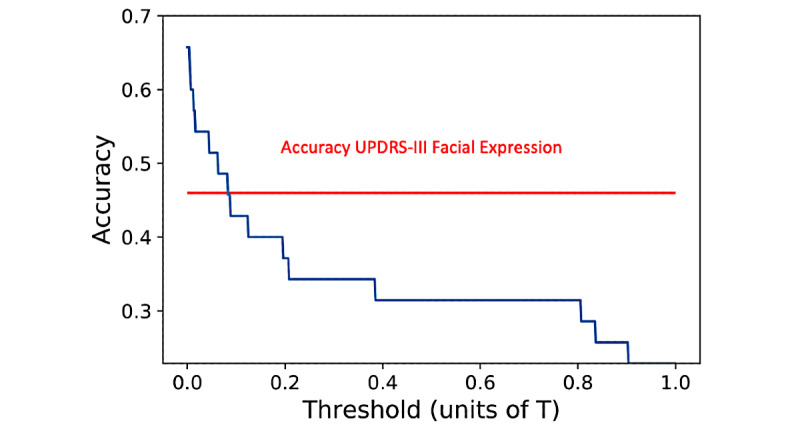
Figure 5.

On-off sensitivity of the Tufts data set. On-off classification for a clinical visit is displayed as a function of threshold. On-off differences are far more subtle than PD versus Control differences (on which the model was originally trained). The red line shows the percentage of participants for which the neurologists rated the UPDRS-III Facial Expression score higher in the off state than in the on state. PD: Parkinson disease; UPDRS: United Parkinson Disease Rating Scale.
