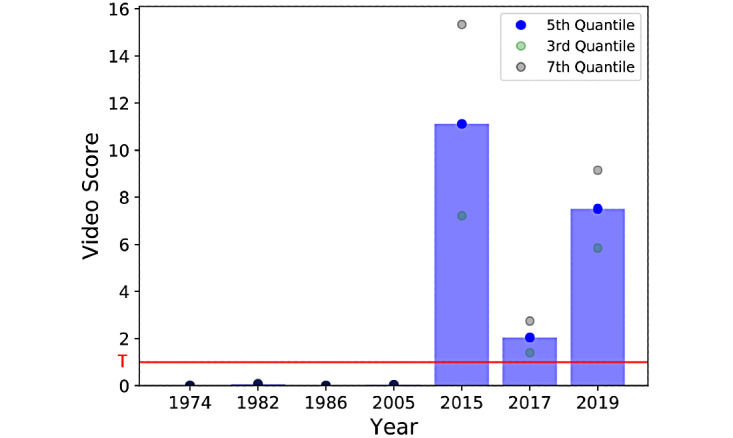
Figure 6.

Validation with Alan Alda interviews. All videos after Mr Alda’s PD diagnosis are above the threshold T, whereas videos before his PD diagnosis are below T (horizontal red line), indicating that the algorithm is sensitive to PD hypomimia symptomatology. Dots show the confidence interval (third quantile and seventh quantile of the video density distribution). PD: Parkinson disease.
