
Figure 2.
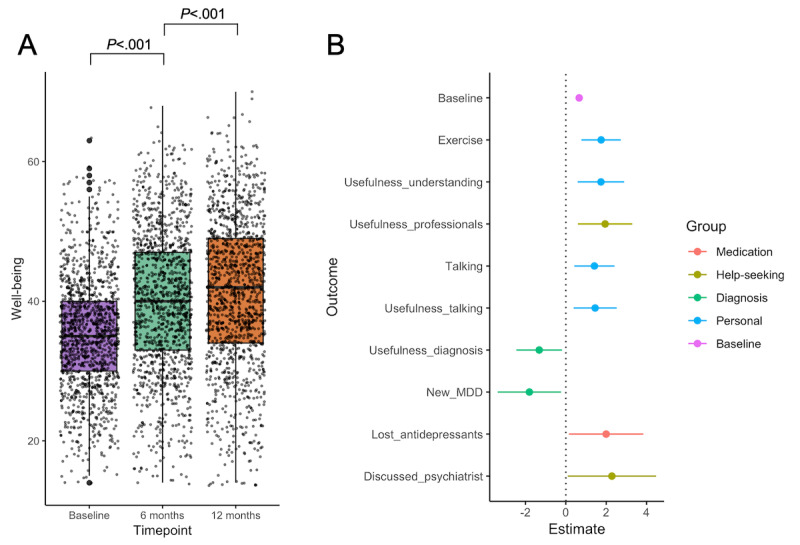
Longitudinal mental wellbeing of Delta Study participants. (A) Distribution of Warwick-Edinburgh Mental Wellbeing Scale (WEMWBS) scores at all three time points for all participants who completed both the 6- and 12-month follow-up. P values were calculated using paired t tests. (B) Significant predictors of 6-month WEMWBS scores. Dot-and-whisker plot shows regression coefficient estimates and their 95% confidence intervals. The colors correspond to 5 outcome groups: blue for all personal outcomes; orange, yellow, and green for each clinical outcome (medication, help-seeking, and diagnosis, respectively); and purple for baseline. MDD: major depressive disorder.