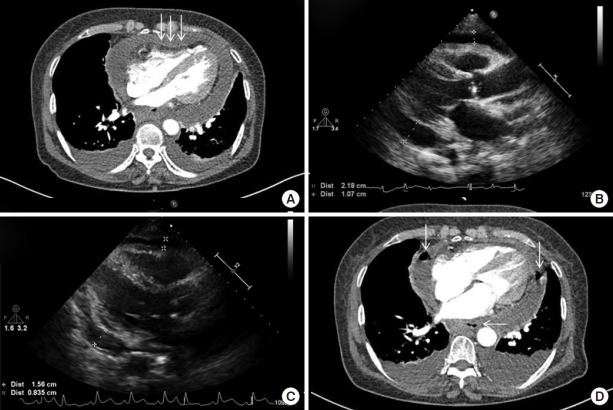
Figure 2.
Changes in chest computed tomography (Chest CT) and echocardiogram. (A) Chest CT scan showing compression of the right ventricle (white arrows) due to pericardial effusion. (B) Transthoracic echocardiogram showing massive pericardial effusion. (C) After pericardiocentesis, transthoracic echocardiogram showing a decreased amount of pericardial effusion. (D) Chest CT scan showing loculated pericardial effusion with multi-focal air bubbles (white arrows) in the pericardial space.

