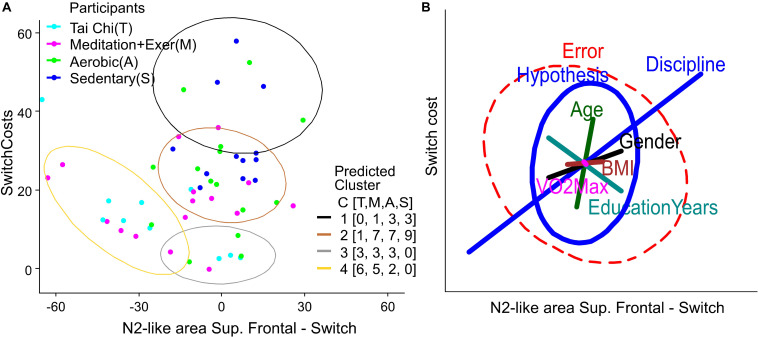
FIGURE 6.
Clusters and variables weight in Behavior-ERP relationship. (A) K-Mean clusters of switch cost and N2-like of right superior parietal domain. The legend labeled as participants is colored by group, light blue for Tai Chi (T), light red for meditation + exercise (M), green for Aerobic fitness (A) and blue for Sedentary participants (S). The legend labeled as Predicted Cluster contains the colors of ellipses that show the output of participants by cluster number from 1 to 4. Additionally, it contains a counting of participants by group in C [T,M,A,S]. (B) Ellipses represent the hypothesis and error effects of the MANCOVA model and its orientation, with the relation between variables shown in the x and y axis. The ellipse length represents the effect size in the corrected model, its width represents the data dispersion. The line length in colors represents the effect of the difference factor and covariables in the corrected model. The line orientation represents the relation between x and y variables.

