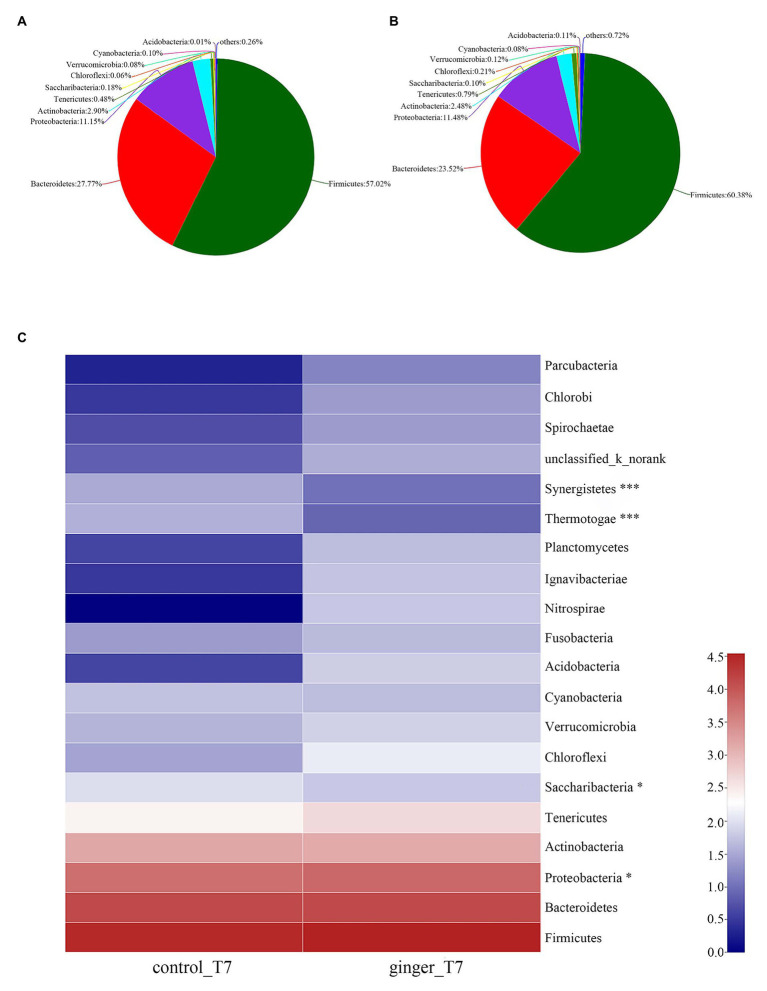
Figure 4.
Gut microbiota composition changes between the control and ginger groups at time point T7. Relative abundance of bacterial groups in the feces of the (A) control group samples and the (B) ginger group samples at the phylum levels. Less than 0.1% abundance of the phyla was merged into others. (C) Community heatmap analysis. The abscissa is the group name, and the ordinate is the bacterial species name at the phylum levels. The intensity of the colors represented the degree of the abundance of different species in the two groups of samples. Significant species are marked by *p < 0.05; ***p < 0.001.

