
Figure 4.
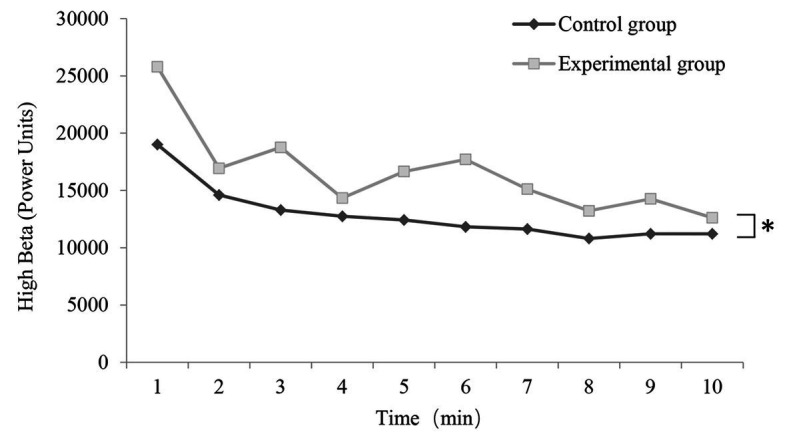
Change in high beta wave (power units) value in each 1-min epoch in the control and experimental conditions (n = 50; mean ± SD; *p < 0.05; verified by repeated ANOVA and multivariate variance statistical test).
Official websites use .gov
A
.gov website belongs to an official
government organization in the United States.
Secure .gov websites use HTTPS
A lock (
) or https:// means you've safely
connected to the .gov website. Share sensitive
information only on official, secure websites.
Change in high beta wave (power units) value in each 1-min epoch in the control and experimental conditions (n = 50; mean ± SD; *p < 0.05; verified by repeated ANOVA and multivariate variance statistical test).