
Figure 5.
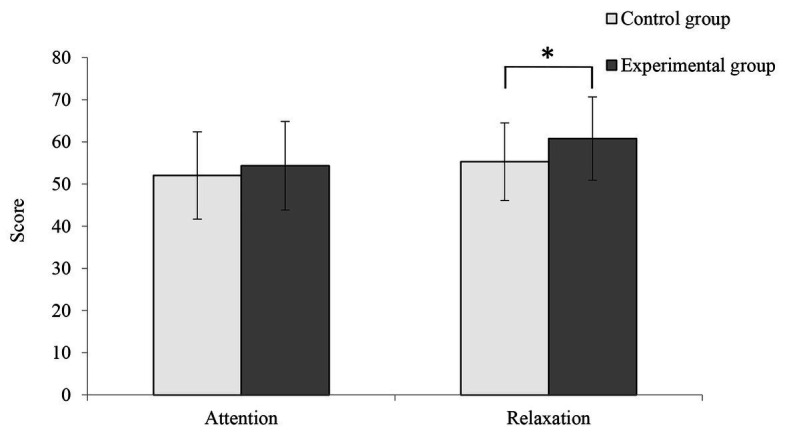
Comparison of mean attention and relaxation scores between the control and experimental conditions (n = 50; mean ± SD; *p < 0.05; verified by one way ANOVA).
Official websites use .gov
A
.gov website belongs to an official
government organization in the United States.
Secure .gov websites use HTTPS
A lock (
) or https:// means you've safely
connected to the .gov website. Share sensitive
information only on official, secure websites.
Comparison of mean attention and relaxation scores between the control and experimental conditions (n = 50; mean ± SD; *p < 0.05; verified by one way ANOVA).