Figure 1.
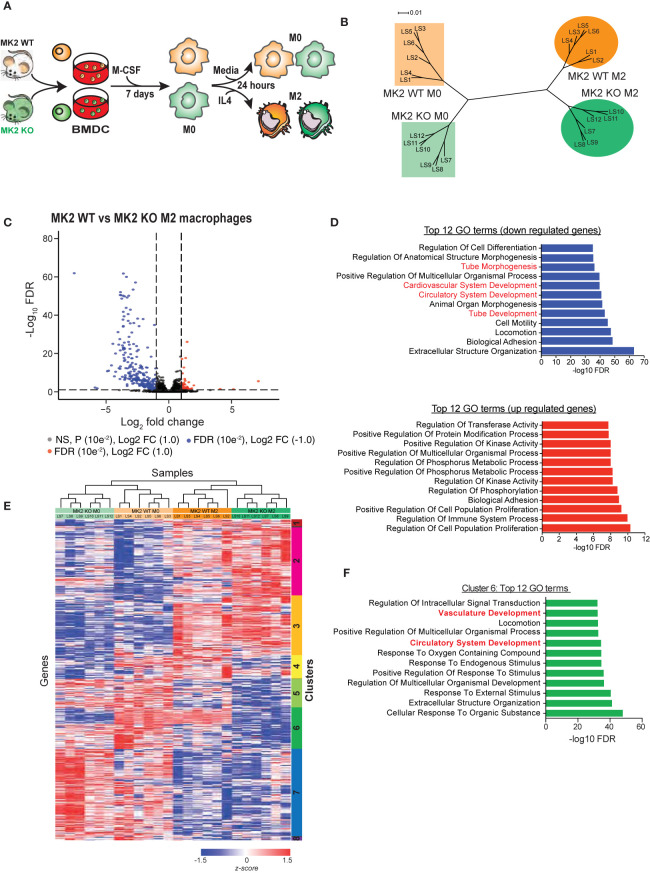
MK2 deficiency markedly alters the transcriptional program during M2 macrophage polarization. (A) Experimental scheme for polarization of bone marrow-derived cells from MK2 WT and MK2 KO mice into M0 and M2 macrophages. (B) Dendrogram visualization of unsupervised hierarchical clustering analysis of RNA-Seq data for M0 and M2-polarized macrophages derived from MK2 WT and KO mice. (C) Volcano plot showing the significantly expressed differential genes following edgeR analysis of M2 macrophages derived from MK2 WT and KO mice. (D) GSEA analysis identifies the top 12 down- and up-regulated GO terms that differ between M2-polarized macrophages derived from MK2 WT and KO mice. (E) Heatmap of RNA-Seq expression for genes that are differentially expressed between MK2 WT M0, MK2 WT M2, MK2 KO M0 and MK2 KO M2 (FDR <0.05, all pairwise comparisons). Expression values were converted to z-scores to facilitate visualization. (F) Hypergeometric test GSEA identification of the top 12 GO terms corresponding to genes in cluster 6 of panel E that are dysregulated in MK2-deficient macrophages, compared to WT macrophages, following M2 polarization.

