
FIGURE 3.
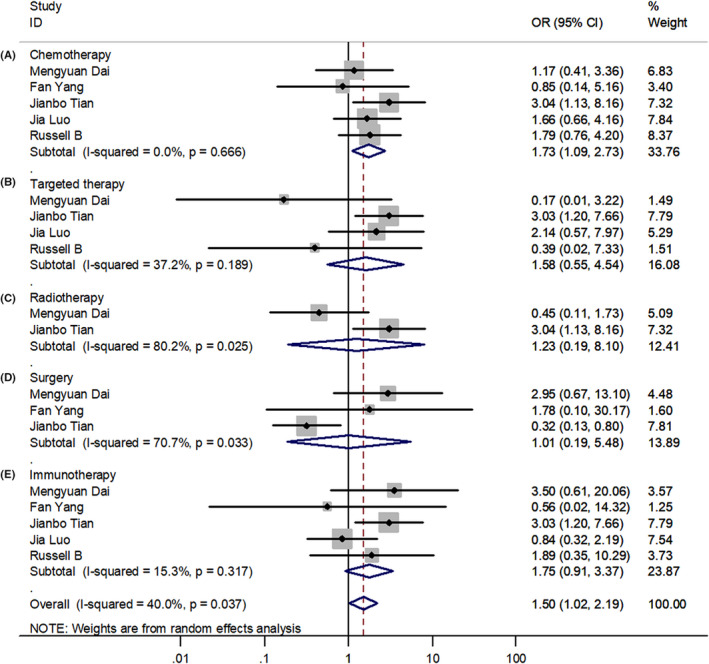
Forest plots of different antitumor therapies. (A‐E) Forest plot between severe and non‐severe groups for patients receiving chemotherapy, targeted therapy, radiotherapy, surgery, and immunotherapy; OR, Odds ratio
Official websites use .gov
A
.gov website belongs to an official
government organization in the United States.
Secure .gov websites use HTTPS
A lock (
) or https:// means you've safely
connected to the .gov website. Share sensitive
information only on official, secure websites.
Forest plots of different antitumor therapies. (A‐E) Forest plot between severe and non‐severe groups for patients receiving chemotherapy, targeted therapy, radiotherapy, surgery, and immunotherapy; OR, Odds ratio