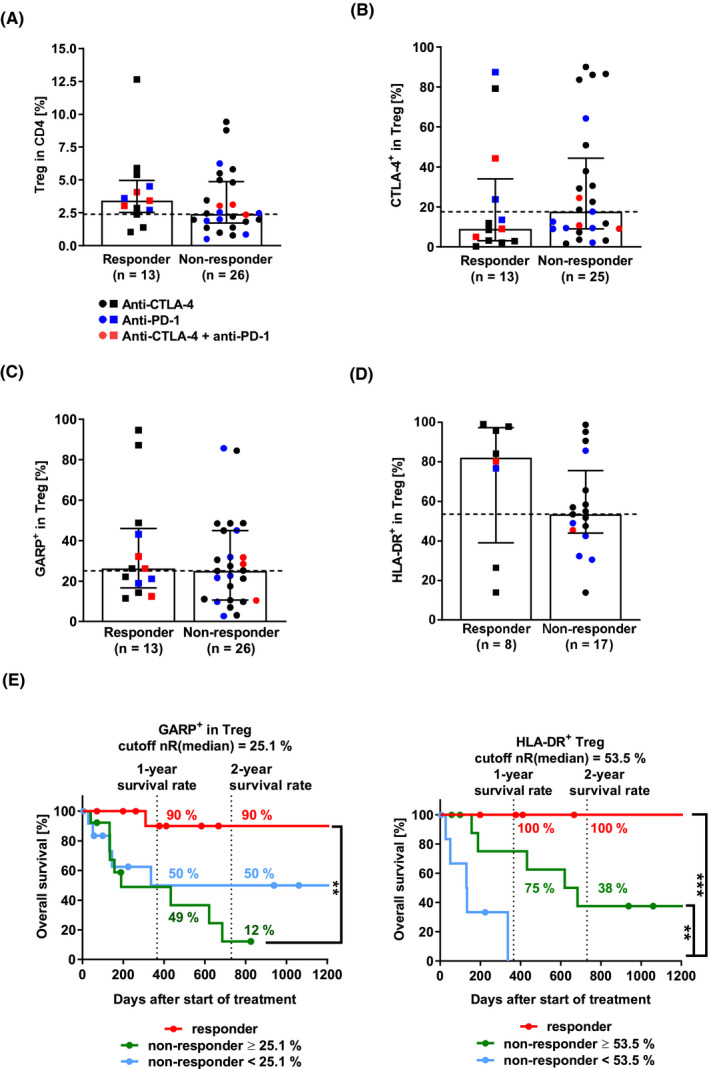
FIGURE 3.

Immunomonitoring of regulatory T cells (Treg). (A) Treg. The bar diagram depicts the percentage of CD4+ CD25+CD127lowFoxp3+ Treg in CD4+ T cells (two‐tailed Mann‐Whitney test, p = 0.1681). (B) CTLA‐4+ Treg (p = 0.2101). (C) GARP+ Treg (p = 0.4525). (D) HLA‐DR+ Treg (p = 0.2154). (E) Survival analysis of patients depending on GARP+ and HLA‐DR+ Treg (Log‐rank (Mantel‐Cox) test, GARP+ Treg, p(nR >25.1% vs. R) = 0.0011 **; HLA‐DR+ Treg, p(nR >53.5% vs. nR <53.5%) = 0.0069 **, p(nR <53.5% vs. R) = 0.0006 ***). Median with interquartile range. CTLA‐4, cytotoxic T‐lymphocyte–associated protein 4; Foxp3, forkhead protein 3; GARP, glycoprotein A repetitions predominant; HLA‐DR, human leukocyte antigen‐DR isotype; nR, non‐responder; PD‐1, programmed cell death protein 1; R, responder; Treg, regulatory T cells
