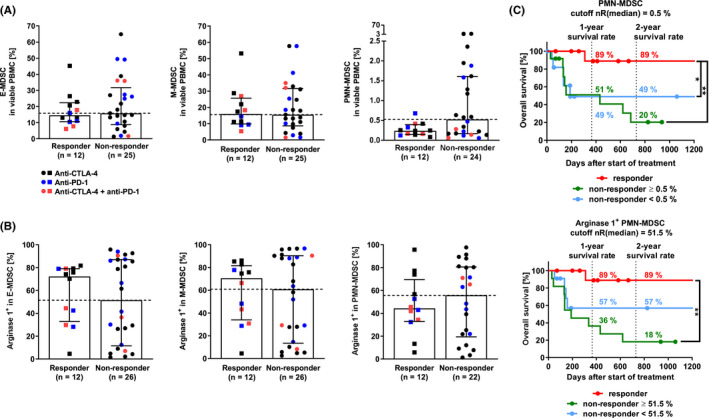
FIGURE 4.

Immunomonitoring of myeloid‐derived suppressor cells (MDSC). Analysis distinguished CD15−CD14+CD33highHLA‐DRlow mononuclear/monocytic MDSC (M‐MDSC), CD15+CD33+ polymorphonuclear MDSC (PMN‐MDSC), and HLA‐DRlowCD11b+CD33+ early MDSC (E‐MDSC). The MDSC gating strategy is depicted in Figure S2A. (A) MDSC (two‐tailed Mann‐Whitney test, p(E‐MDSC) = 0.6658, p(M‐MDSC) = 0.9872, p(PMN‐MDSC) = 0.1042). (B) Arginase 1+ MDSC (p(arginase 1+ E‐MDSC) = 0.9630, p(arginase 1+ M‐MDSC) = 0.8405, p(arginase 1+ PMN‐MDSC) = 0.7900). (C) Survival analysis of patients depending on (arginase 1+) PMN‐MDSC (Log‐rank (Mantel‐Cox) test, PMN‐MDSC, p(nR >0.5% vs. R) = 0.0064 **, p(nR <0.5% vs. R) = 0.0422 *; arginase 1+ PMN‐MDSC, p(nR >51.5% vs. R) = 0.0018 **). Median with interquartile range. CTLA‐4, cytotoxic T‐lymphocyte–associated protein 4; E‐MDSC, early MDSC; HLA‐DR, human leukocyte antigen‐DR isotype; M‐MDSC, monocytic/mononuclear myeloid‐derived suppressor cells; nR, non‐responder; PD‐1, programmed cell death protein 1; PMN‐MDSC, polymorphonuclear MDSC; R, responder
