
FIGURE 2.
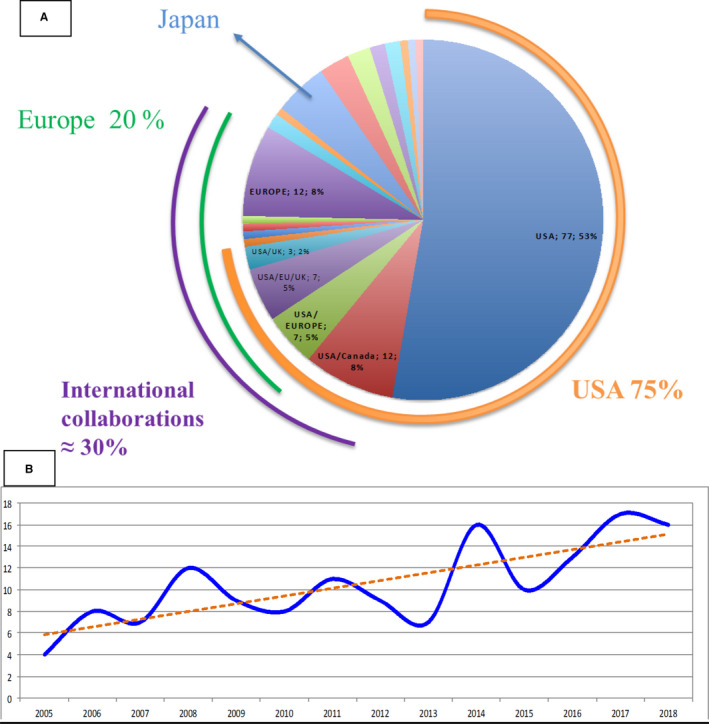
Geographic and temporal distribution of the 146 phase‐II trials in recurrent or refractory Ewing sarcoma. (A) Number of trials opened according to the location. (B) Number of trials opened over time
Official websites use .gov
A
.gov website belongs to an official
government organization in the United States.
Secure .gov websites use HTTPS
A lock (
) or https:// means you've safely
connected to the .gov website. Share sensitive
information only on official, secure websites.
Geographic and temporal distribution of the 146 phase‐II trials in recurrent or refractory Ewing sarcoma. (A) Number of trials opened according to the location. (B) Number of trials opened over time