
FIGURE 5.
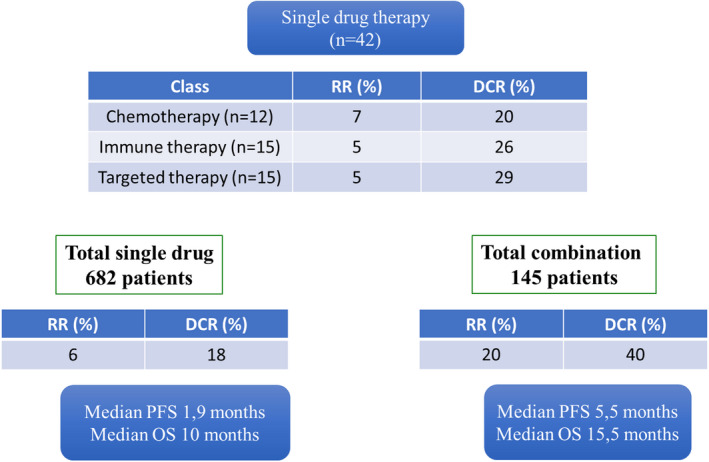
Description of phase‐I/II response rate in the 62 published trials according to pharmaceutical class and single drug versus combination
Official websites use .gov
A
.gov website belongs to an official
government organization in the United States.
Secure .gov websites use HTTPS
A lock (
) or https:// means you've safely
connected to the .gov website. Share sensitive
information only on official, secure websites.
Description of phase‐I/II response rate in the 62 published trials according to pharmaceutical class and single drug versus combination