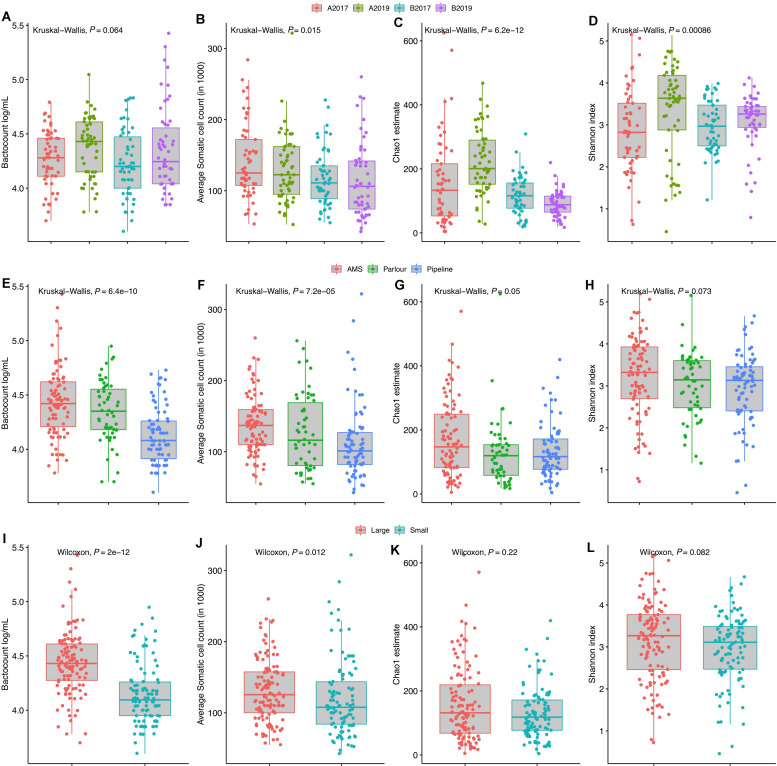
FIGURE 1.
Distribution of total bacterial counts, average somatic cell counts, alpha richness and diversity grouped by year and geographical area (A–D), milking system (E–H), and farm size (I–L). The average number of cows in Norway (28) was used to group the farms into “small” and “large” farms. P-value for the non-parametric analysis of variance (Kruskal–Wallis or Wilcoxon test) is reported in each plot.

