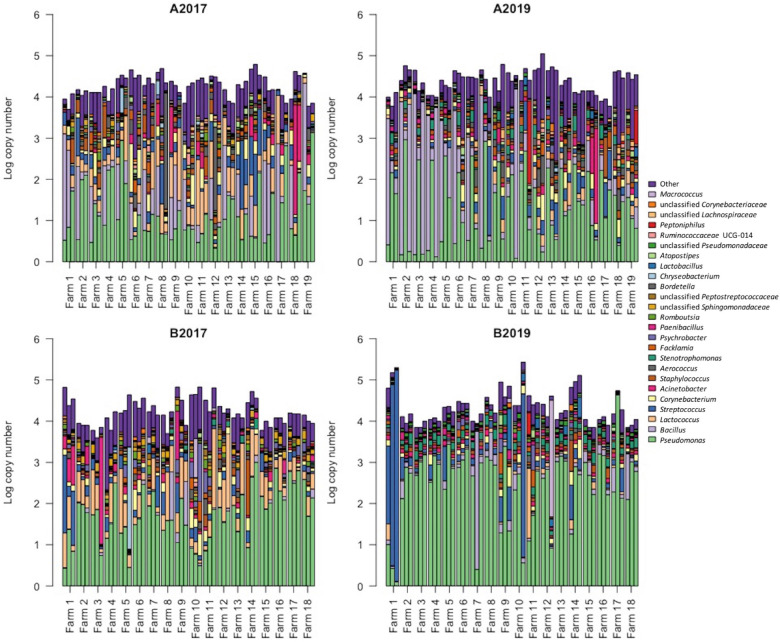
FIGURE 3.
Distribution of the 25 most abundant genera detected in raw milk samples. Each bar represents a sample of milk and each farm was sampled three times. The height of each bar indicates the absolute level of bacteria (in log TBC). The color distribution of each bar was obtained by (1) correcting the relative abundance by the average number of ribosomal RNA operons obtained for each genus and (2) normalizing the relative abundances (in %) against the absolute bacterial level. A: Farm 1–19 collected in area A; B: farm 1–18 collected in area B. 2017: samples collected in the year 2017 and 2019: samples collected in 2019. Data from 2017 were previously published in Skeie et al. (2019).

