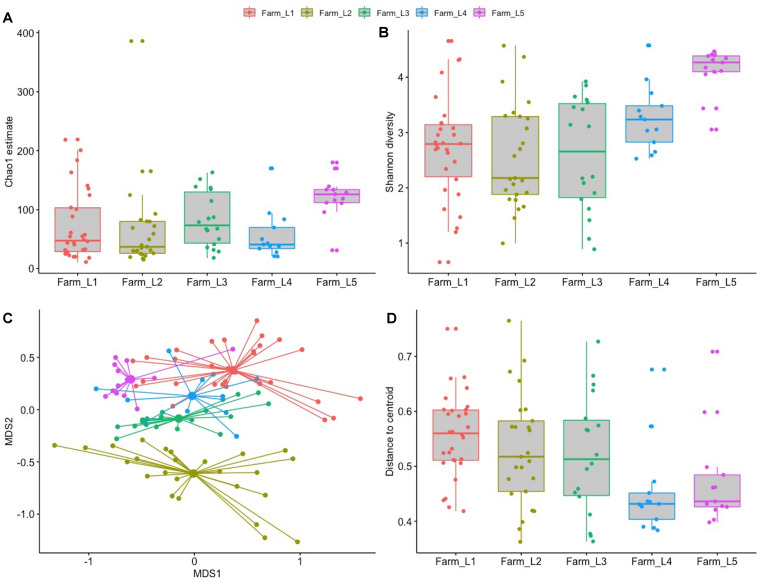
FIGURE 6.
Alpha and beta diversity of the bulk tank milk microbiota of five farms sampled over a period of several months. (A) Chao1 richness estimation grouped by farm. (B) Shannon diversity grouped by farm. (C) NMDS plot of the bulk tank microbiota obtained using the Bray–Curtis dissimilarity matrix. (D) Beta dispersion of homogeneity grouped by farm.

