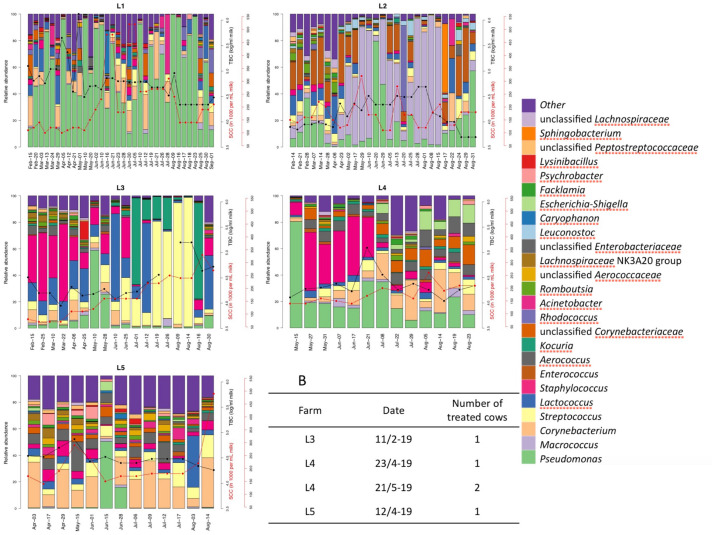
FIGURE 7.
Relative abundance of the bulk tank milk microbiota of five farms (L1–L5) in the period February–August 2019. Somatic cell count (red lines) and total bacterial count (black lines) are reported for the milk delivered from the farms in the same period of the microbiota analysis. B: list of clinical mastitis cases reported by the five farms during the period of sampling and the number of cows treated. Somatic cell count, bacterial count and clinical mastitis reports were obtained from the Norwegian Dairy Herd Recording System.

