
FIGURE 4.
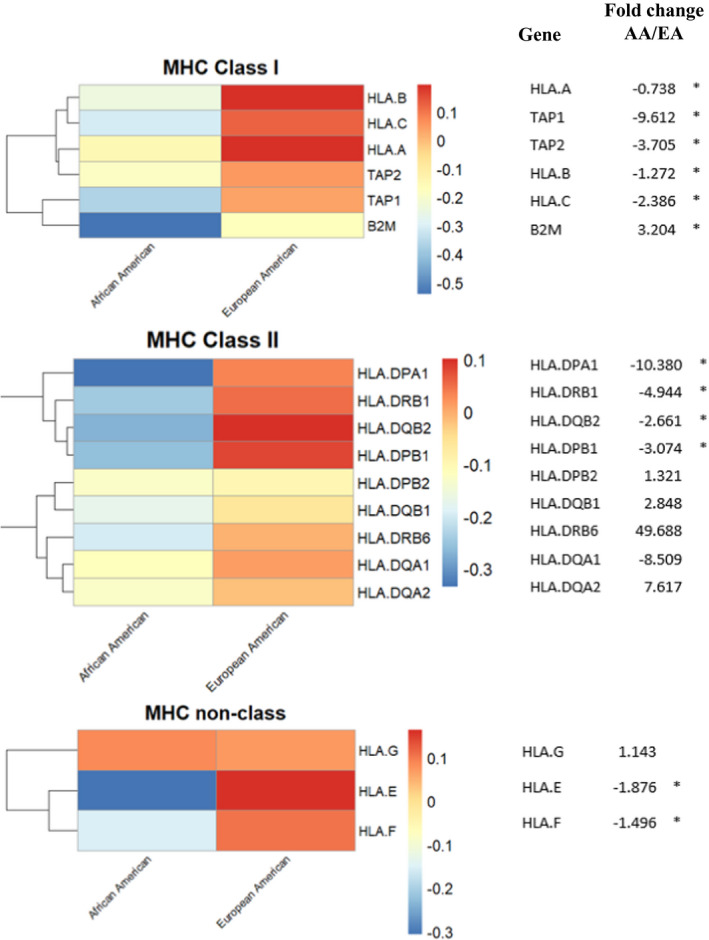
Association of MHC gene expression with race. The heatmap presents averaged gene expressions (z‐scores) for major histocompatibility complex (MHC) genes in each racial group. Log2 fold changes are provided, where * denotes p‐value <0.05, indicating the significant racial differences in expressions between the two racial groups