Fig. 5.

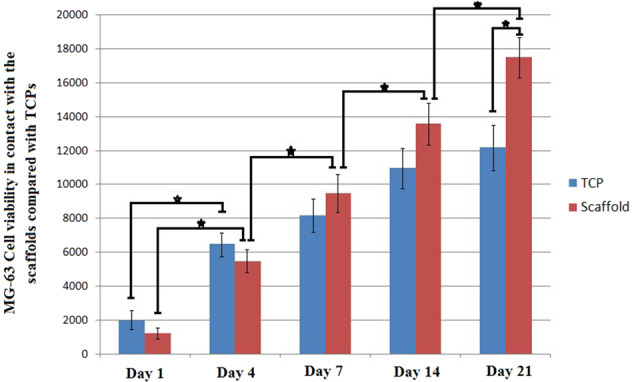
MG-63 cell viability in contact with the prepare scaffolds compared to TCPS at the considered time points. Significant difference is denoted as * (p < 0.05). Error bars represent the standard deviation of three independent measurements

MG-63 cell viability in contact with the prepare scaffolds compared to TCPS at the considered time points. Significant difference is denoted as * (p < 0.05). Error bars represent the standard deviation of three independent measurements