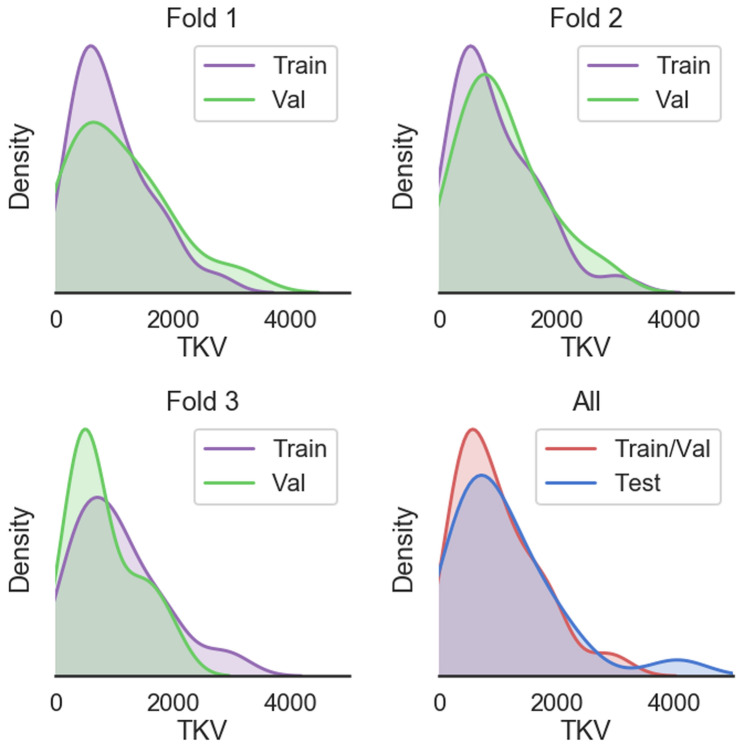
Fig. 1.
Visualization of density distributions of total kidney volume for the three folds (Fold 1: top left, Fold 2: top right, Fold 3: bottom left), and the entire training and validation sets as well as the separate hold out test set (bottom right). The cross-validation folds were randomly separated into the distinct subsets. The network model was trained on the three folds and an ensemble network was made and applied to the hold out test set

