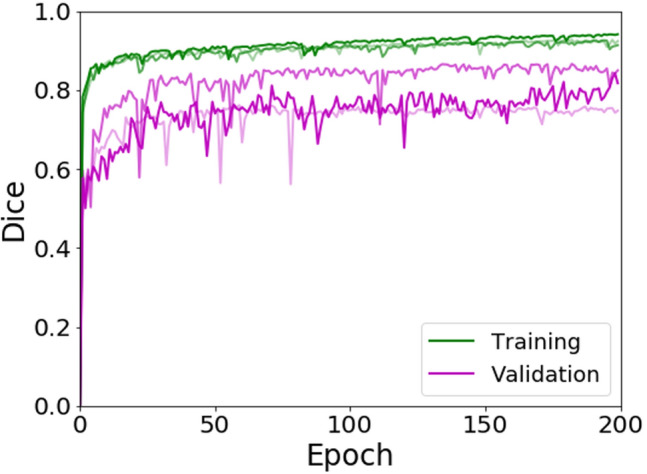
Fig. 2.

Learning curves for training and validation datasets from the three different folds. The darkness of the line corresponds to the higher fold number (i.e., Fold 3 is the darkest line). The Dice similarity metric was calculated at each epoch. In the case of fold 1, the final training Dice was 0.91 and validation was 0.76. In the case of fold 2, the final training Dice was 0.92 and validation was 0.87. For fold 3, the final training Dice was 0.94 and validation was 0.84
