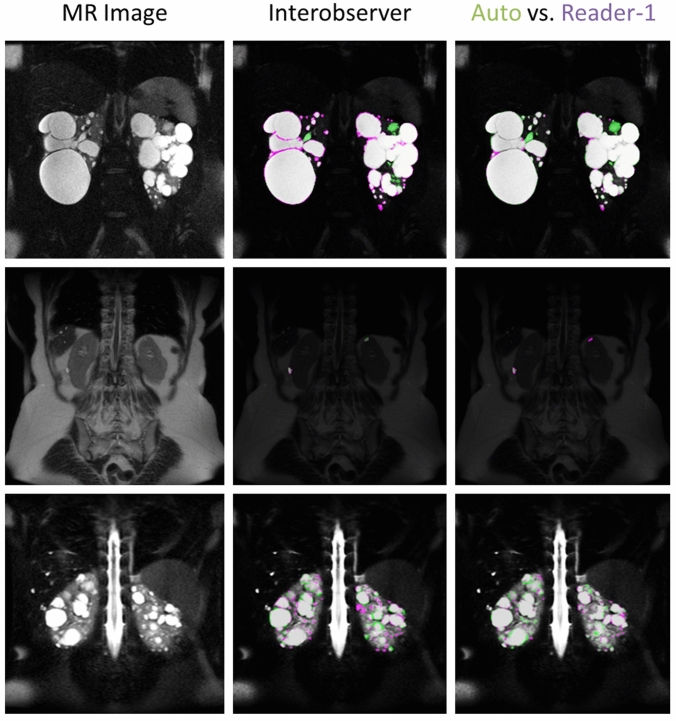
Fig. 6.
Visual comparisons between the interobserver segmentations and the automated approach compared to Reader-1. Shown in the left column are the MR images, the middle column are the gold-standard tracings comparing Reader-1 (violet) to Reader-2 (green), and right column compares Reader-1 (violet) to the automated approach (green). The top row highlights one of the best cases, with a Dice of 0.96 for interobserver, and 0.97 for the automated approach compared with Reader-1. The middle row is the worst case in terms of the automated methods performance, with an interobserver Dice metric of 0.66 and an automated Dice of 0.50 vs. Reader-1. The bottom row highlights a fairly typical case in terms of performance, with interobserver Dice of 0.84, and automated Dice of 0.86 vs. Reader-1. Regions that are seen to cause the greatest variability for both manual tracings as well as the automated approach are bright vessels, the renal pelvis, as well as complex cysts (appearing dark on the T2-weighted images). Agreement between the two is shown as dark gray/transparent. The background image is darkened in order to better visualize the segmentation overlap

