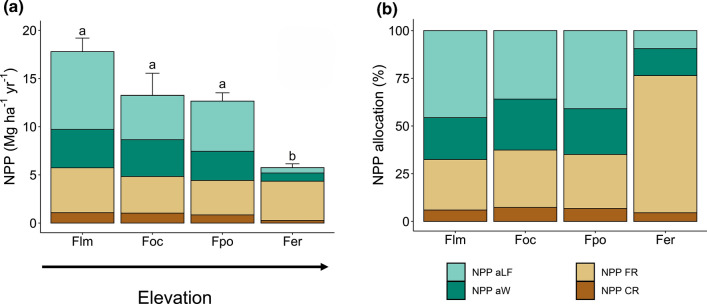
Fig. 1.
a Net primary productivity (NPP) of the four forest types by components, and b relative allocation of carbon to the different NPP components. All values are means ± SE (n = 3). Different lower case letters indicate significant differences between total NPP values of the different forest types according to a Tukey HSD test (P < 0.05). Flm lower montane forest, Foc Ocotea forest, Fpo Podocarpus forest, Fer Erica forest, aLF aboveground litterfall, aW aboveground wood, CR coarse roots, FR fine roots

