Fig. 3.
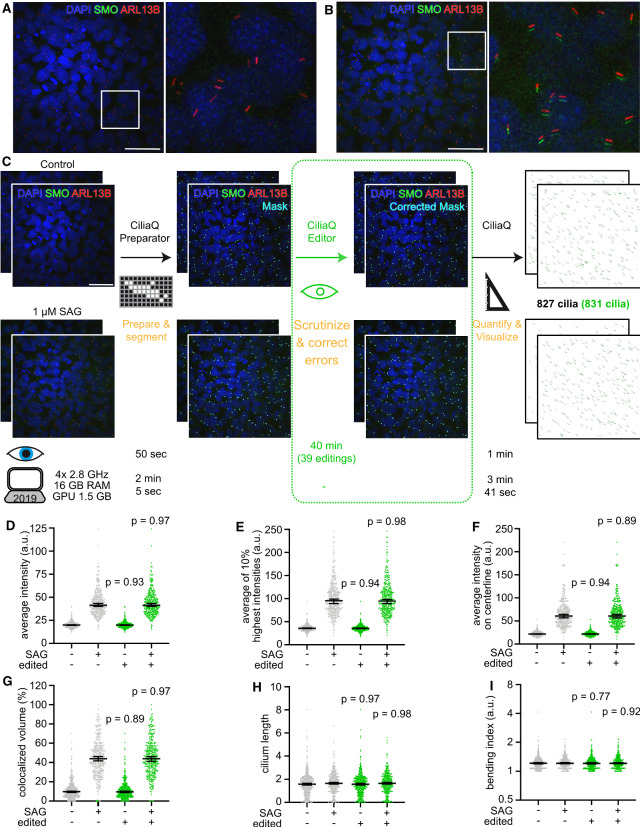
Exemplary CiliaQ analysis of ciliary localization of a protein of interest. a, b Exemplary confocal 3D stacks acquired from serum-starved mouse embryonic fibroblasts that were either unstimulated (a) or stimulated with Smoothened agonist (SAG, , b) for 24 h before fixation and staining with an ARL13B antibody to label cilia, a Smoothened (SMO) antibody, and with DAPI to label nuclei. Scale bars: . In all images, the green channel (SMO) was shifted by 7 px to the bottom for better visualizing SMO accumulation in cilia. c Analysis workflow for the dataset presented in a and b, including two 3D stacks per condition. The four stacks were segmented using CiliaQ Preparator and next, either directly quantified with CiliaQ Editor (black steps applied only in workflow), revealing 827 cilia, or segmentation errors were corrected with CiliaQ Editor before quantification of the images with CiliaQ (black and green steps applied in workflow), revealing 831 cilia. Below the individual steps, the time required for the analysis is plotted: Eye: the time requiring direct user interaction; Computer symbols: the time for computer-controlled automated analysis without user interaction on notebooks with the indicated specifications. Scale bar: . d–i CiliaQ results of the analysis demonstrated in c. d–g Parameters that describe the intensity of the SMO signal. h, i morphological parameters. Gray: CiliaQ results obtained from uncorrected segmented images. Green: CiliaQ results obtained from images corrected/edited with CiliaQ Editor. P-values indicate the test results of a Mann–Whitney test compared to the uncorrected results for the respective condition. Each data point represents an individual cilium. Bars indicate median ± 95% confidence interval of the median

