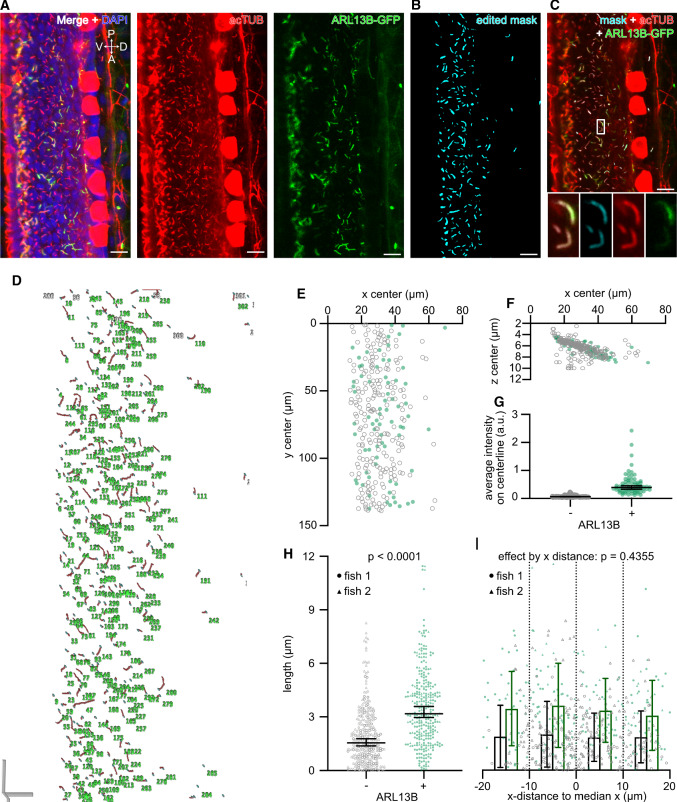
Fig. 5.
CiliaQ analysis of cilia in a tissue, i.e., the zebrafish spinal cord. a Exemplary slice from a confocal stack through the spinal cord of a zebrafish embryo (28 h post fertilization), genetically expressing ARL13B-GFP in some cells, stained with an acetylated Tubulin (acTUB) antibody to label cilia and DAPI to label nuclei. Left: all three labels. Middle: acTUB channel only. Right: ARL13B channel only. V ventral, D dorsal, P posterior, A anterior. b Corrected mask generated by segmentation and editing of the stack shown in a using CiliaQ Preparator and CiliaQ Editor, respectively. c Overlay of the corrected mask and the original channels. Magnified view of the position indicated with the white box is shown at the bottom for all channels merged (left) or the corrected mask (middle left), the acTUB channel (middle right), or the ARL13B channel (right) only. The images shown in a–c map the same stack positions. d 3D visualization (skeleton representation output by CiliaQ), e–f coordinates and g ARL13B intensity of the cilia detected by CiliaQ analysis. h Length of the cilia detected by CiliaQ analysis. Results pooled from fish. P-value for an unpaired, two-sided Mann–Whitney test indicated. i Data from h, replotted by distance of the cilia in x to the median x position for each fish. P-value for the factor x-distance determined using a 2-way ANOVA (). Results for ARL13B-negative and ARL13B-positive cilia were separated based on the CiliaQ parameter colocalized volume measured in the ARL13B channel: cilia with a colocalized volume above 0 were considered ARL13B-positive. Scale bars:

