Fig. 7.
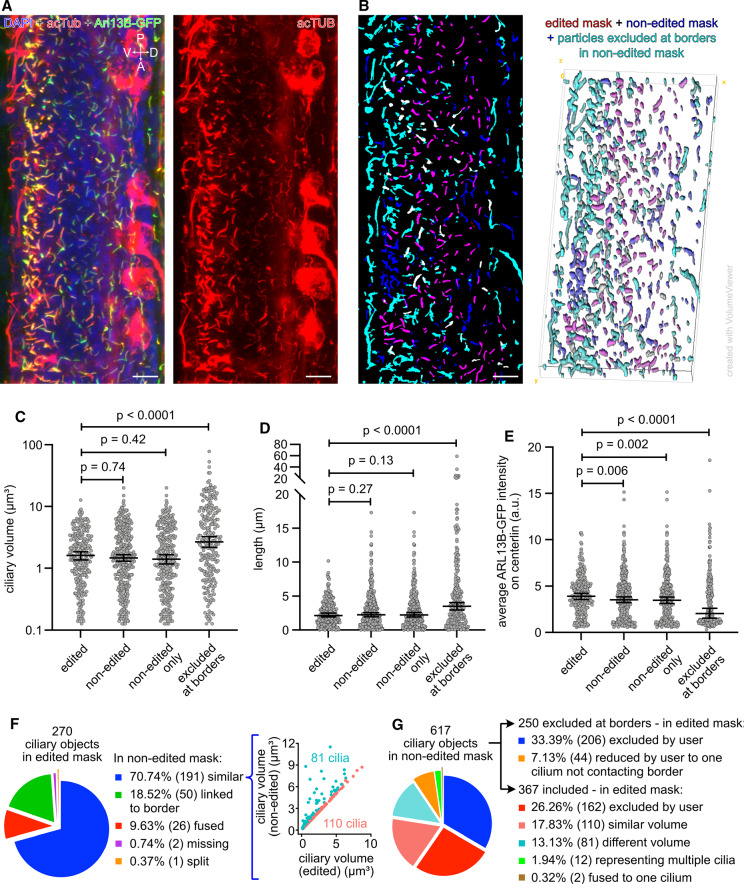
Accuracy of automated CiliaQ analysis using an image of the spinal cord in a zebrafish embryo. a Maximum projection of a confocal stack through the spinal cord of a zebrafish embryo (28 h post fertilization), genetically expressing ARL13B-GFP in some cells, stained with an acetylated Tubulin (acTUB) antibody to label cilia and DAPI to label nuclei. Left: all three labels. Right: acTUB channel only. V ventral, D dorsal, P posterior, A anterior. b Overlay of (1) the edited mask (red), generated by using CiliaQ Preparator, CiliaQ Editor for manual correction of the segmentations, and CiliaQ for excluding particles touching borders or not exceeding a size threshold (10 voxel), of (2) the non-edited mask (blue), generated as the edited mask but without manual corrections, and of (3) particles that were excluded from the non-edited mask by CiliaQ due to touching the borders (cyan). Left: Maximum projection of the mask stack. Right: 3D rendering of the mask stack. Objects in magenta are present in both, the edited and non-edited mask (mixing color of blue and red). Objects in white represent cilia that were manually included but excluded from the non-edited mask because of fusion to particles that were connected to the borders of the image (mixing color of cyan and red). c–e CiliaQ output parameters determined based on analyzing the masks shown in B. Results are plotted by different groups of cilia: (1) ciliary objects detected by analyzing the edited mask, (2) ciliary objects detected by analyzing the non-edited mask (excluding cilia at the border of the image in CiliaQ), (3) ciliary objects that were detected only in the non-edited mask, (4) ciliary objects excluded from the non-edited mask in CiliaQ because of touching the borders of the image. P-values for Kolmogorov–Smirnov tests, which compare the cumulative distributions, are indicated. f and g Comparative analysis of the ciliary objects reconstructed based on the edited and based on the non-edited mask. f Left: Appearance of ciliary objects reconstructed from the edited mask in the non-edited mask. Right: Correlating volumes determined based on the edited mask to volumes determined based on the non-edited mask. Cyan: cilia with a different volume in non-edited and edited mask (volumetric difference ). Rose: cilia with similar volume in non-edited and edited mask (volumetric difference ). g Appearance of ciliary objects reconstructed from the non-edited mask in the edited mask. Scale bars: . Cilia objects from the edited mask are also presented in Fig. 5g and h as fish 2

