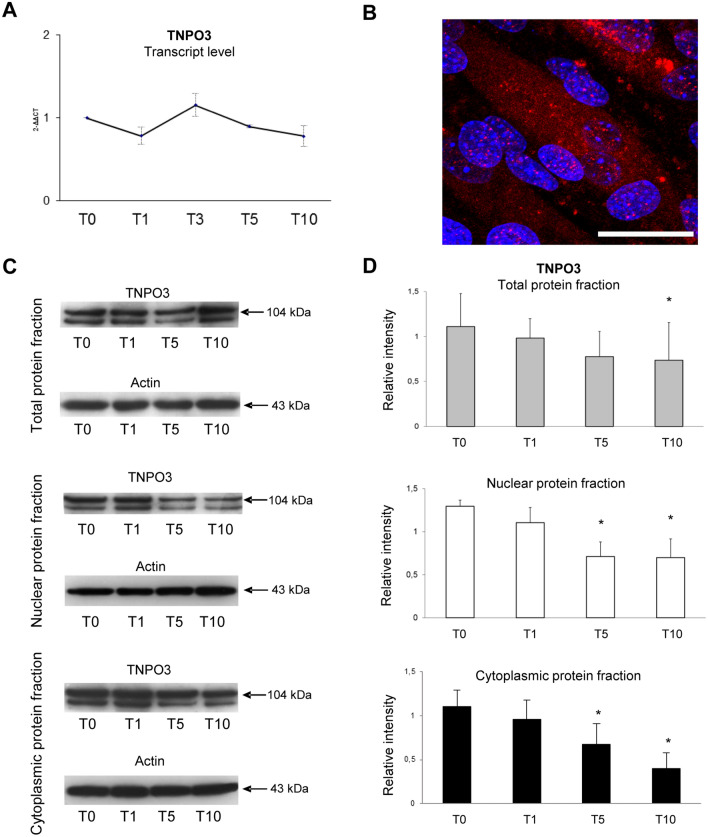
Fig. 1.
Analysis of TNPO3 expression during myogenesis in C2C12 cells. (a) Real-time q-PCR showing TNPO3 transcript level during myogenic differentiation; data are representative of three experiments and expressed as means ± SD. (b) IF staining for TNPO3 expression in C2C12 at T10. TNPO3 in red and nuclei in blue (Scale bar: 20 μm). (c) Western blotting for TNPO3 in total, nuclear and cytoplasmic protein fractions. The blots show two bands for TNPO3 that are probably due to the presence of different splicing isoforms of TNPO3. (d) The bands were quantitated by calculating the relative quantities of TNPO3 normalized to Actin. Data are representative of three experiments and expressed as mean ± SD; the level of significance was set at p < 0.05

