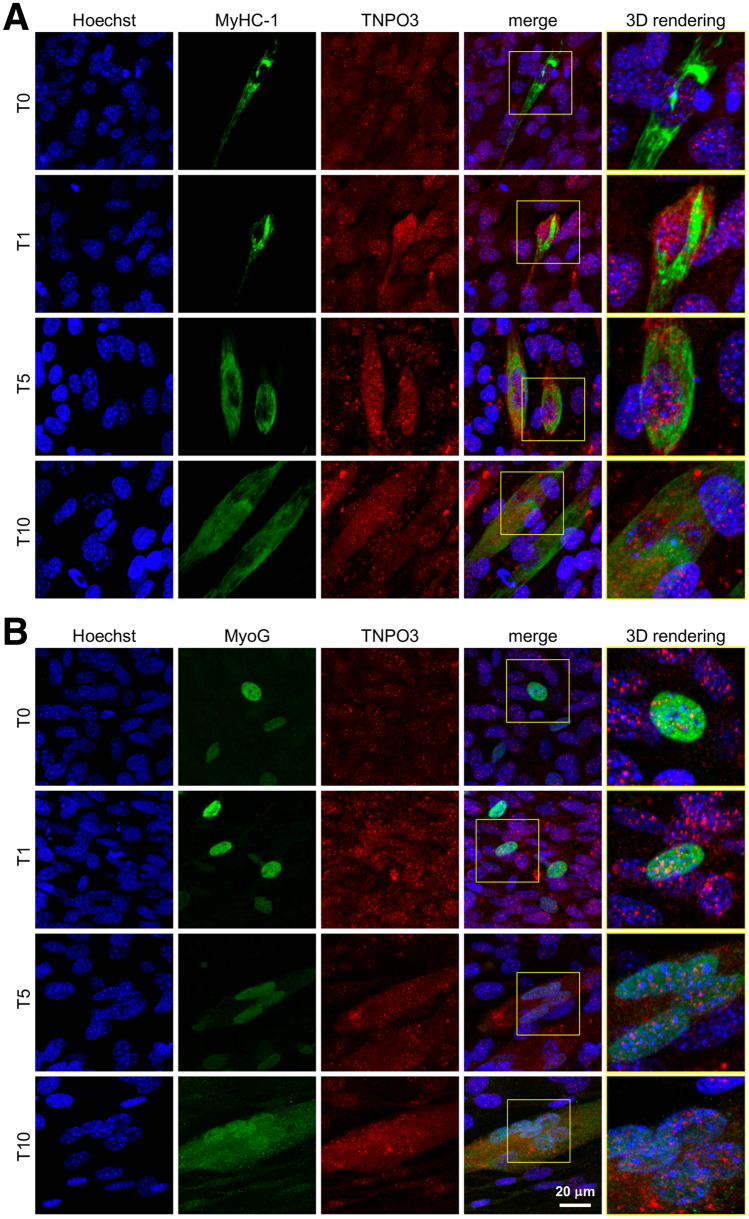
Fig. 2.
Investigation of TNPO3 localization during myogenesis by confocal microscopy. (a) IF double staining for TNPO3 (in red) and MyHC-1 (in green). (b) IF double staining for TNPO3 (in red) and MyoG (in green). Nuclei are counterstained with Hoechst (first column, in blue). In the fourth column red and green fluorescent signals are merged and in the fifth column the 3D rendering of the area marked by square. Confocal microscopy investigation showed that during myogenesis TNPO3 tended to increase in intermediate (T5) and late (T10) differentiation steps and it localized mainly in those cells that responded to differentiation stimuli and express MyoG and MyHC-1

