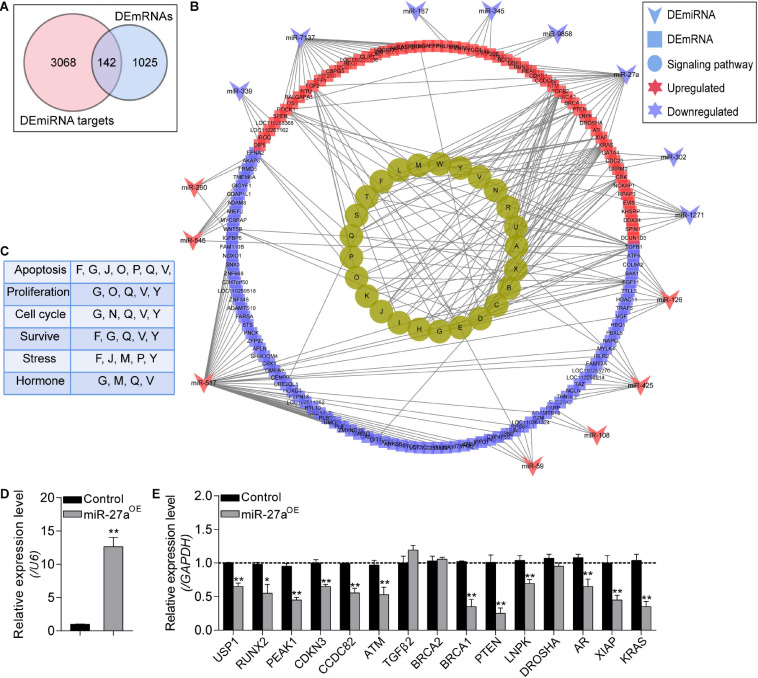
FIGURE 6.
Identification of the NORFA-mediated DEmiRNA–DEmRNA network. (A) Venn diagram showing the common genes that simultaneously belong to the DEmRNAs and the validated target genes of DEmiRNAs. (B) DEmiRNA–DEmRNA pathway network. Arrows indicate DEmiRNAs, squares indicate DEmRNAs, and circles represent the most significant signaling pathways (P < 0.05). The colors depict the changes of the expression patterns (red and purple indicate up- and down-regulated). The identified KEGG pathways were as follows: A, pathways in cancer; B, regulation of actin cytoskeleton; C, microRNAs in cancer; D, HTLV-I infection; E, proteoglycans in cancer; F, ubiquitin mediated proteolysis; G, MAPK signaling pathway; H, renal cell carcinoma; I, melanoma; J, FoxO signaling pathway; K, chronic myeloid leukemia; L, toxoplasmosis; M, focal adhesion; N, cell cycle; O, Rap1 signaling pathway; P, Ras signaling pathway; Q, PI3K-Akt signaling pathway; R, leishmaniasis; S, pancreatic cancer; T, hepatitis B; U, colorectal cancer; V, TGF-β signaling pathway; W, small cell lung cancer; X, prostate cancer; Y, NF-kappa B signaling pathway. (C) The NORFA-mediated pathway–function interactions were analyzed. (D) The expression level of miR-27a in porcine GCs treated with miR-27a mimics was detected by qRT-PCR (n = 3). (E) The interactions between miR-27a and its potential targets within the DEmiRNA–DEmRNA regulatory network were measured by qRT-PCR (n = 3). Data in (D) and (E) were presented as mean ± S.E.M. with three independent replicates, and P values were calculated by a two-tailed Student’s t test. *P < 0.05 and **P < 0.01.

