FIGURE 7.
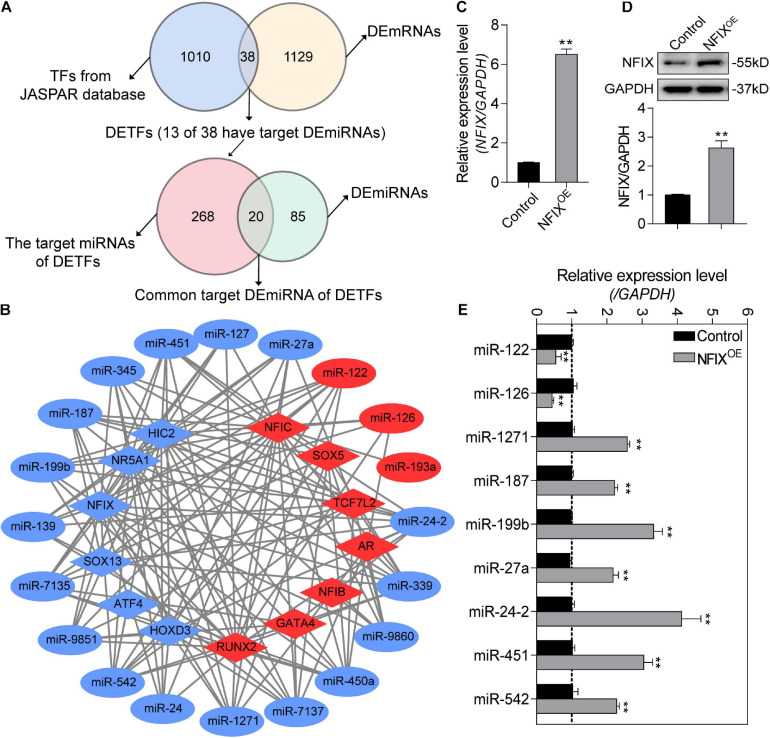
Identification of the potential NORFA-mediated DETF–DEmiRNA regulatory network. (A) Venn diagrams showing the identified DETFs and their target DEmiRNAs. (B) The potential DETF–DEmiRNA regulatory network was constructed. Circles indicate DEmiRNAs and diamonds indicate DETFs. The color depicts the expression patterns (red indicates up-regulated and blue indicates down-regulated). (C,D) The expression of NFIX at both mRNA level (C) and protein level (D) in NFIX overexpressed porcine GCs were detected by qRT-PCR and Western blotting (n = 3). (E) The expression patterns of the potential NFIX-regulated miRNAs in NFIX overexpressed porcine GCs were identified by qRT-PCR (n = 3). Data in (C–E) were shown as mean ± S.E.M. with three independent replicates. P values were calculated by a two-tailed Student’s t test. **P < 0.01.

