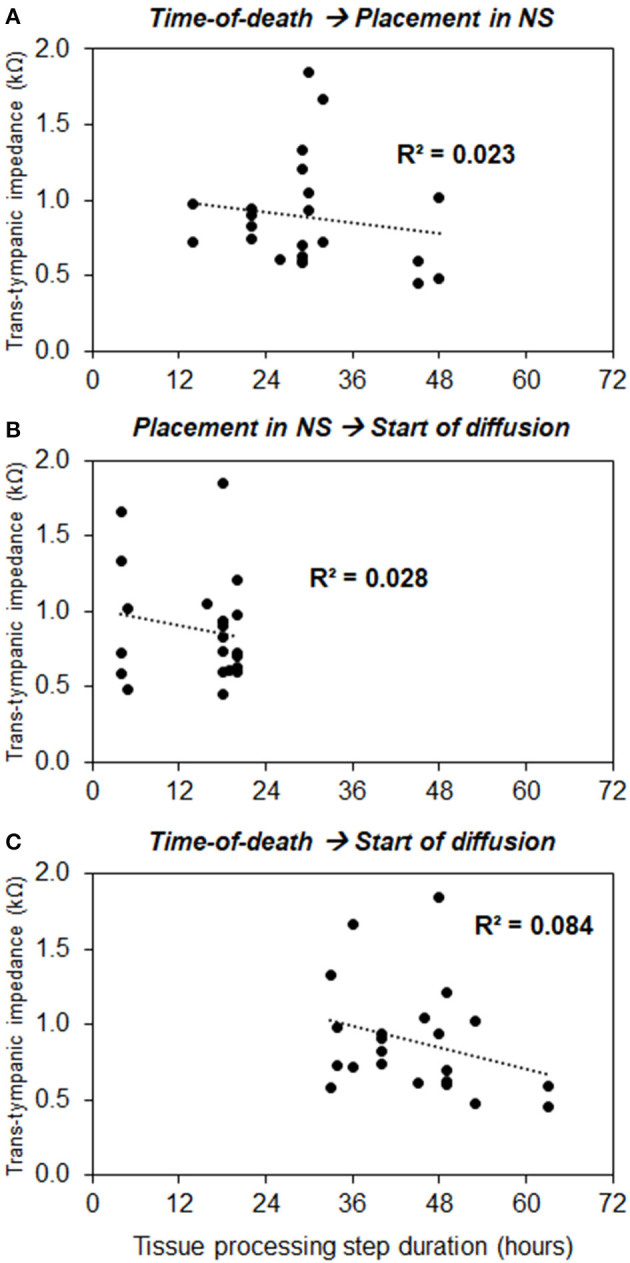
Figure 4.

Correlation between processing times and baseline trans-tympanic impedance measurements, with processing time measured as follows: (A) From time-of-death to placement in normal saline, (B) From placement in normal saline to start of diffusion, and (C) From time-of-death to start of diffusion.
