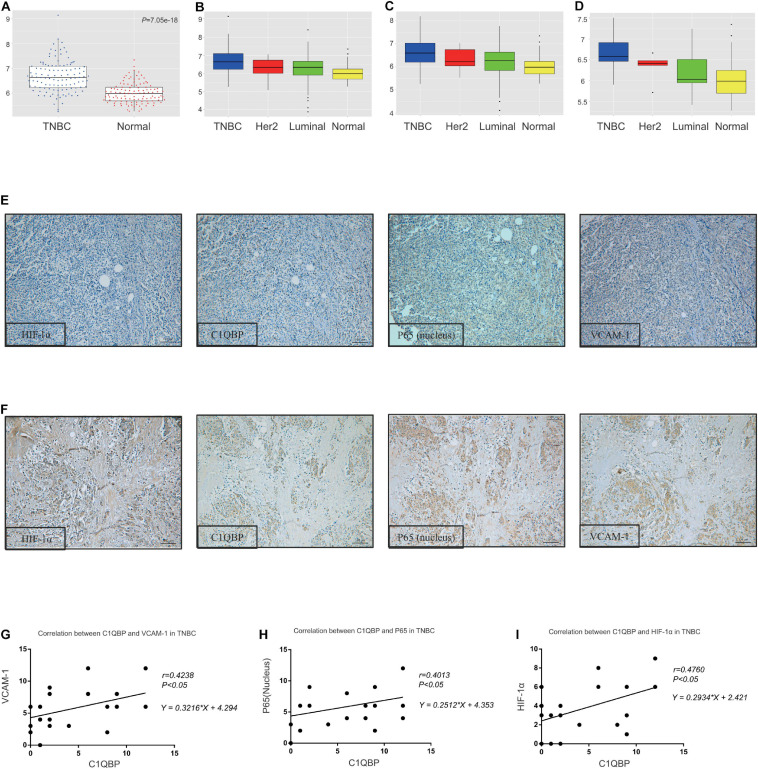
FIGURE 6.
The C1QBP level correlates with VCAM-1 and P65 expression in TNBC patient tissues. (A) Comparison of the expression of C1QBP in TNBC and normal tissues in the TCGA database. (B) Comparison of the expression of C1QBP in TNBC and other subtypes of breast cancer patients in the TCGA database. (C) Comparison of the expression of C1QBP in TNBC and other subtypes of metastatic breast cancer patients in the TCGA database. (D) Comparison of the expression of C1QBP in TNBC and other subtypes of dead breast cancer patients in the TCGA database. (E) Representative IHC images of low levels of HIF-1α, C1QBP, VCAM-1, and P65 in patients with TNBC. (F) Representative IHC images of high levels of HIF-1α, C1QBP, VCAM-1, and P65 in patients with TNBC. (G) Correlation analyses of the IHC staining scores of C1QBP and VCAM-1 levels in the tumor cells of patients with TNBC. (H) Correlation analyses of the IHC staining scores of C1QBP and P65 levels in the tumor cells of patients with TNBC. (I) Correlation analyses of the IHC staining scores of C1QBP and HIF-1α levels in the tumor cells of patients with TNBC.

